May 2023 Real Estate Market Update
May 12, 2023
All Real Estate News

May 12, 2023
All Real Estate News
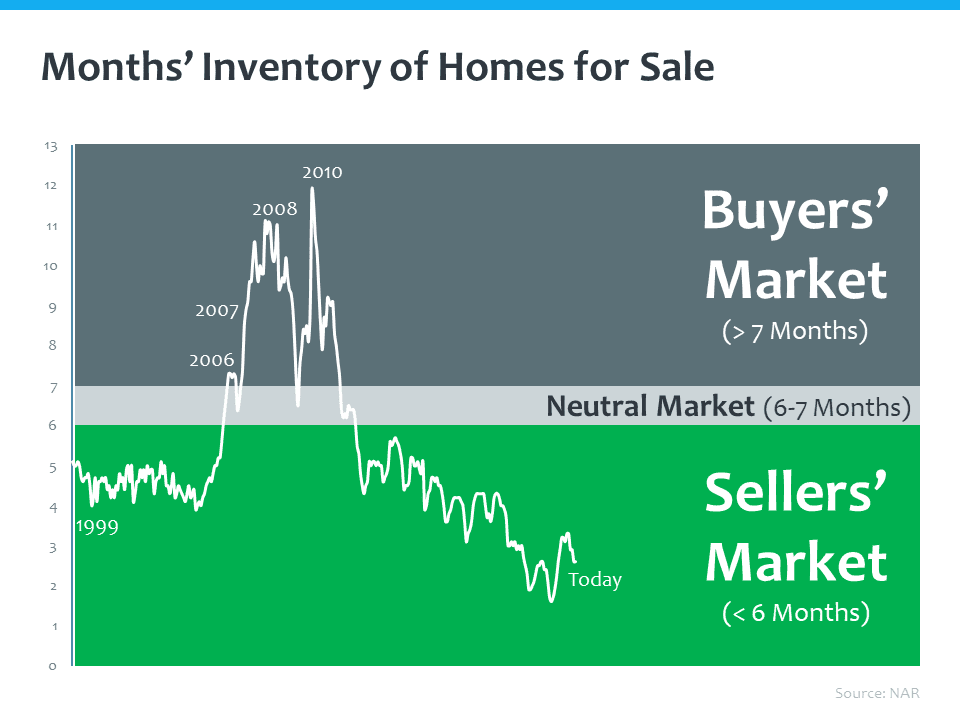
We have recently seen positive movement in home prices, and one reason for this is the lack of inventory. Over the last several years we've been in a seller's market, and we are still there today.
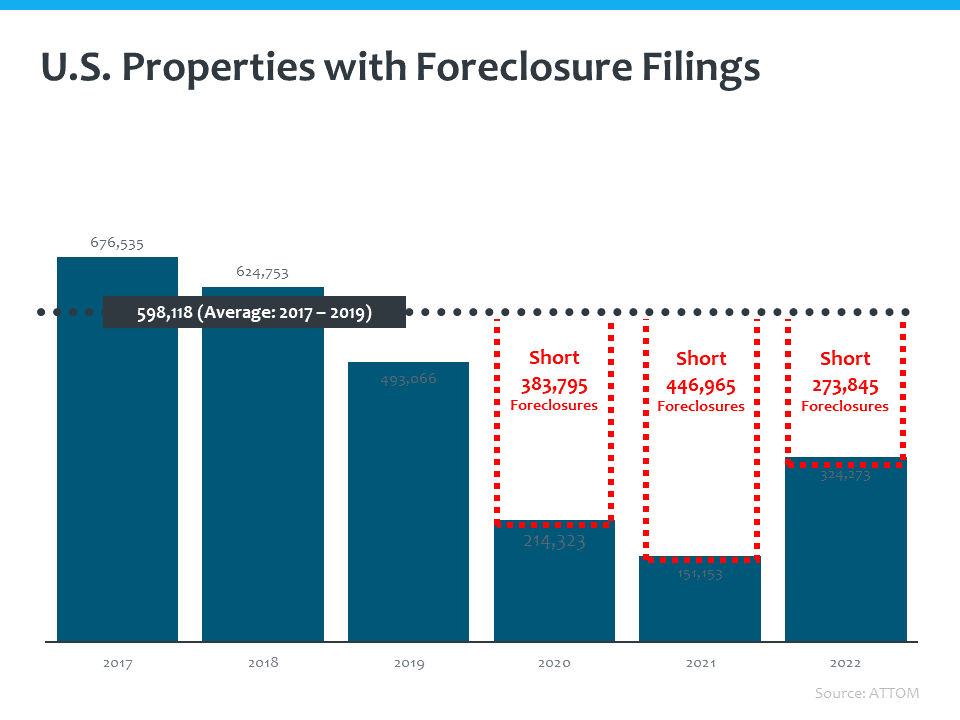
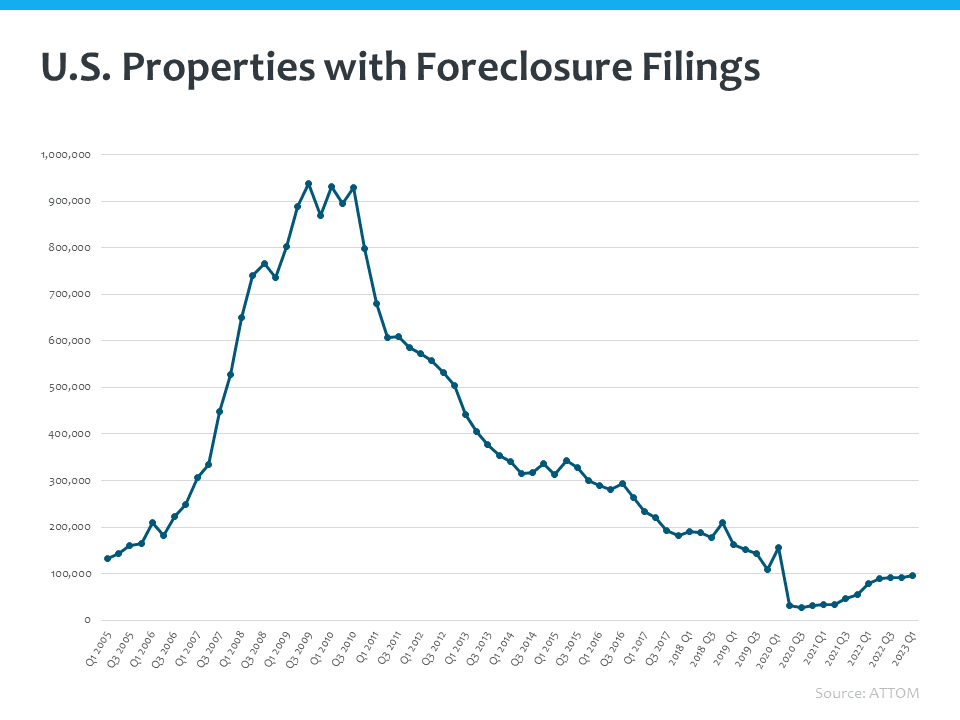
And, although some frightening headlines are floating around that we are seeing dramatic increases in foreclosures, it is important to put that into perspective. Taking a look back at the last “normal” years in the real estate market (2017 – 2019), we can see that we are extremely short of the average foreclosure numbers of those years. Of course, as we come out of the moratorium, we will see foreclosures rise. No doubt. But not at the rate that's going to dramatically impact inventory and shoot us up into a buyer's market.
The peak seen here was during the 2008 housing crisis where we saw over 9 million distressed homes. In the first quarter of this year, we saw 95,712 foreclosure filings.
Another scary headline is the speculation of a recession. In the Fed’s recent meeting, they determined that, in light “of the recent banking-sector developments, the staff’s projection at the time of the March meeting included a mild recession starting later this year...”
So, how would a recession impact housing? Typically, during recessionary times, the Fed lowers the interest rates in an effort to incentivize people to spend money in order to simulate the economy.
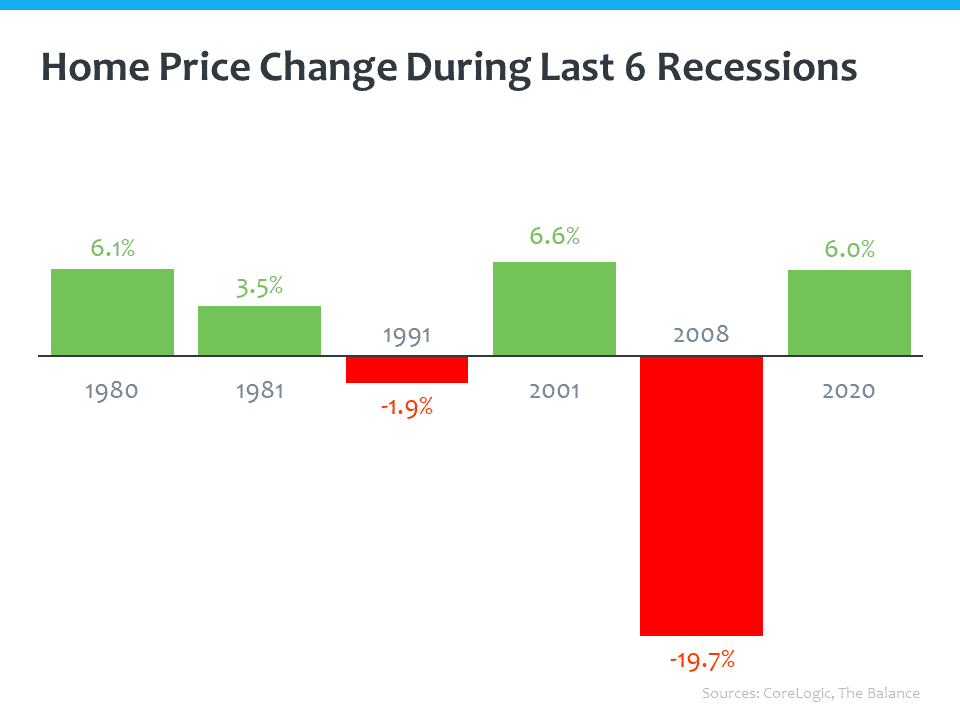
How would a recession impact home prices? Historically, during 4 of the last 6 recessions (going all the way back to 1980), home prices rose.
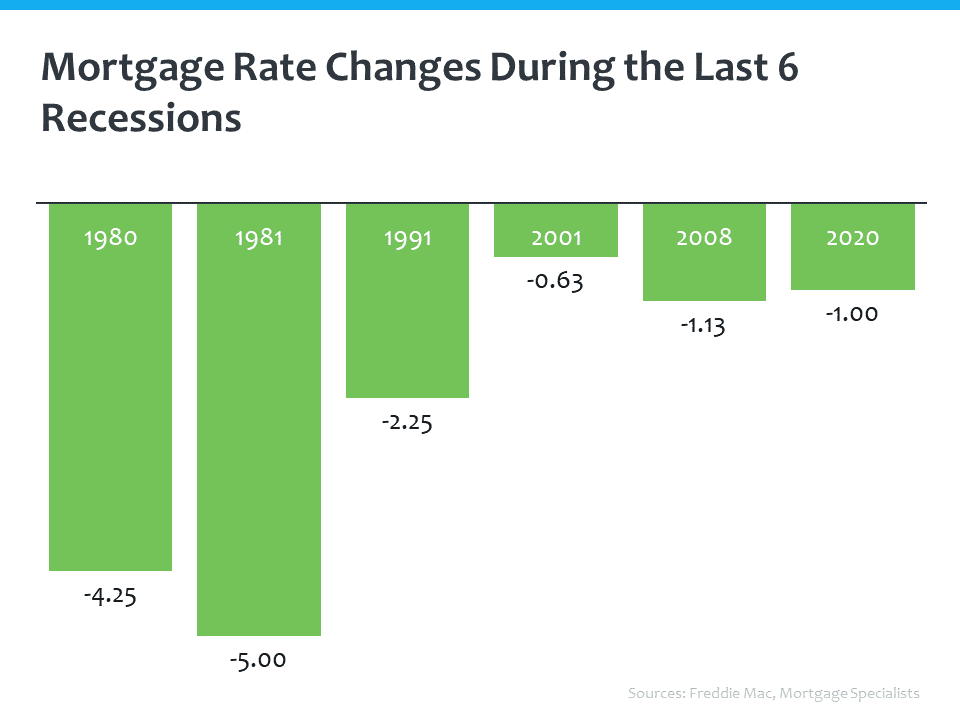
How would a recession impact mortgage rates? Looking back at those same 6 recessions, mortgage rates have fallen.
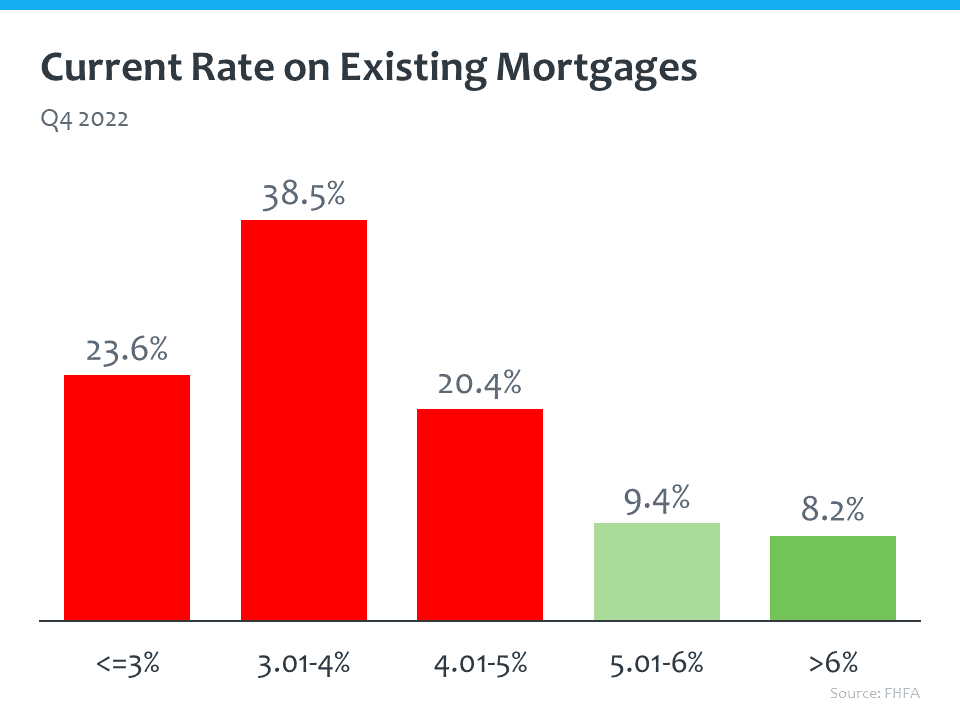
Overall, the current housing market is strong. First, because of the current rates on existing mortgages. Over 80% of mortgages have a mortgage rate below 5% - a very strong foundation for homeowners.
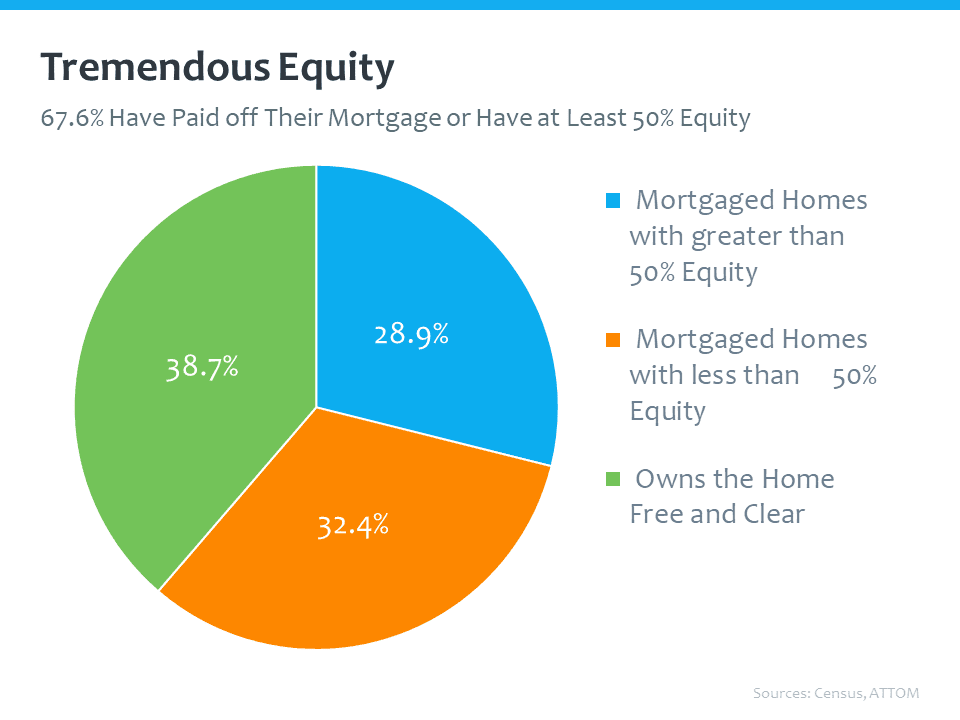
Second, because of the tremendous amount of equity across the country. Almost 40% own their home free and clear, and almost 30% have at least 50% equity. That’s amazing.
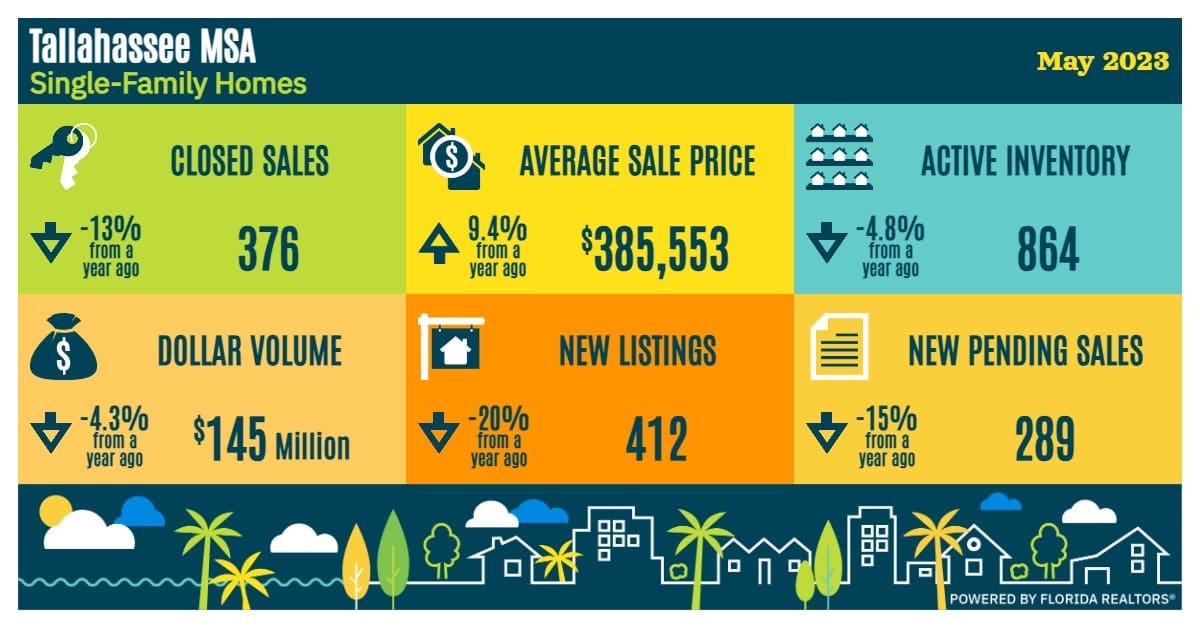
Finally, here are the latest numbers for how we closed out May in Tallahassee.
Stay up to date on the latest real estate trends.

All Real Estate News
November 10, 2026

All Real Estate News
November 10, 2026

Local Events
November 7, 2026

Local Events
November 6, 2026

All Real Estate News
November 4, 2026

All Real Estate News
November 3, 2026
You’ve got questions and we can’t wait to answer them.