January 2023 Real Estate Market Update
January 11, 2023
Monthly Market Updates

January 11, 2023
Monthly Market Updates
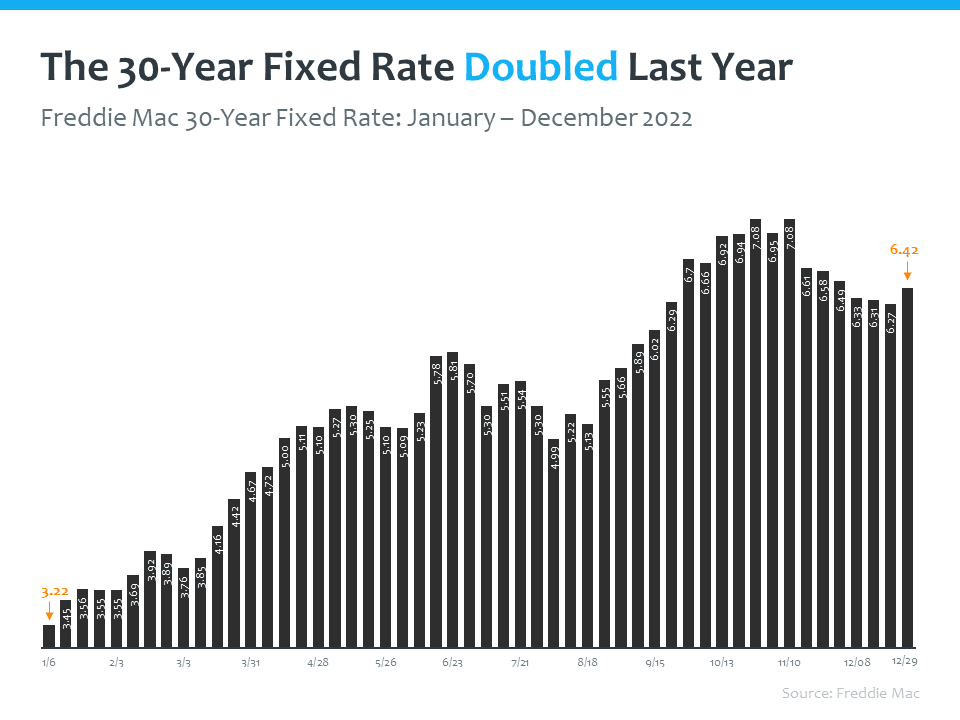
The reality is that is the 30-year fixed mortgage rate doubled over the last year – a historic spike. Staring at 3.2% in January, and ending at 6.4% in December.
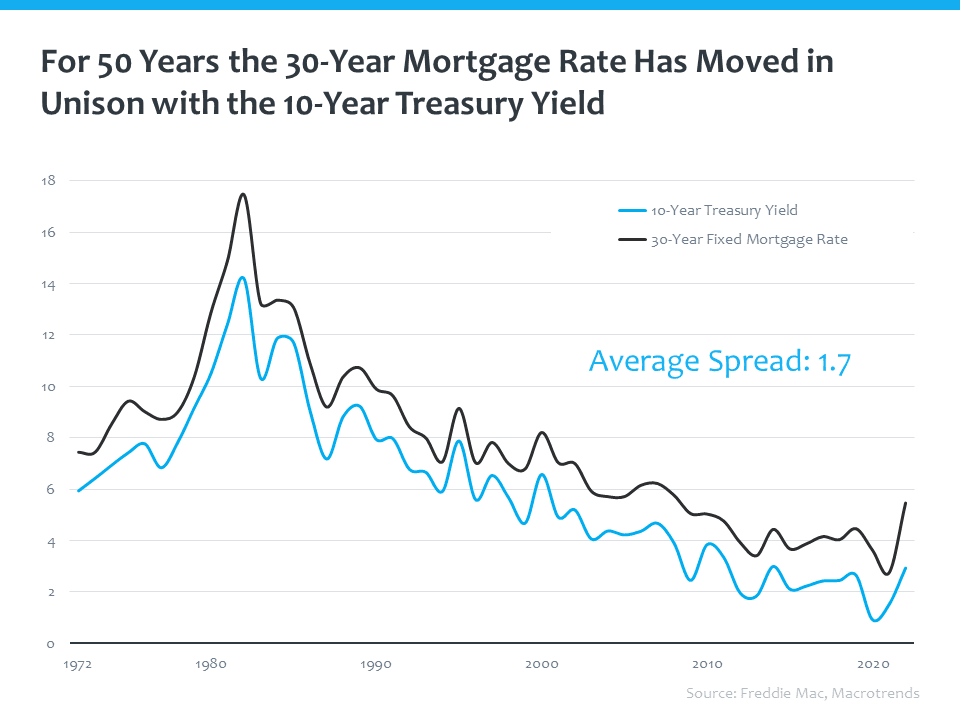
Last month we broke down the relationship between the 30-year fixed mortgage rate and the 10-year treasury yield. These two move in unison with each other with an average difference, or spread, of 1.7%.
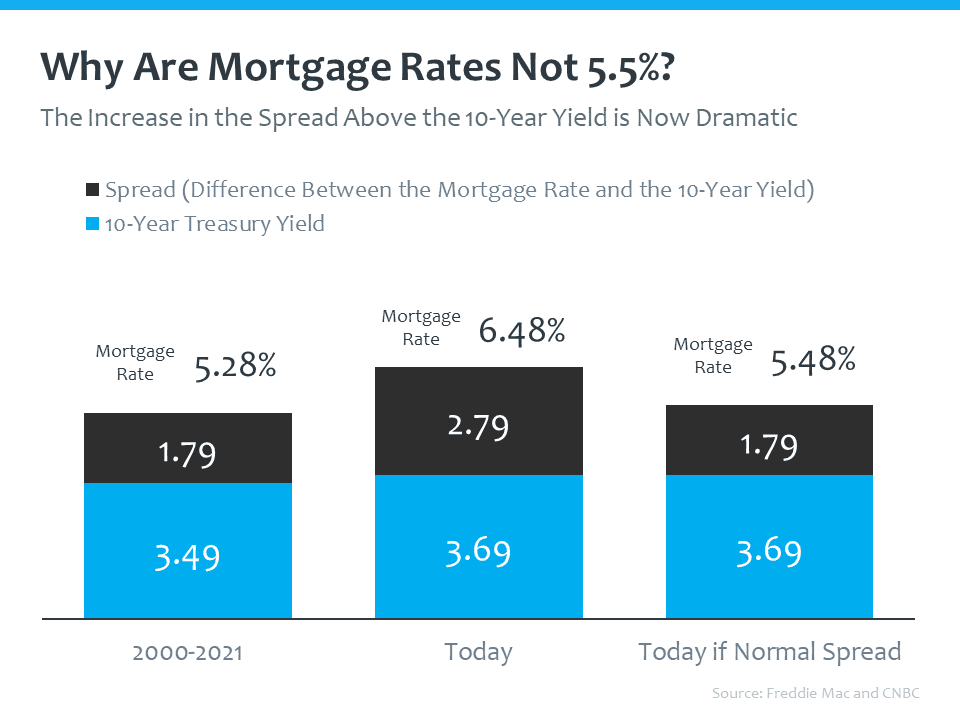
With that 1.7% in mind, today’s mortgage rates should be 5.5%, rather than the reality of 6.5%. Why has the spread has widened over the last year?
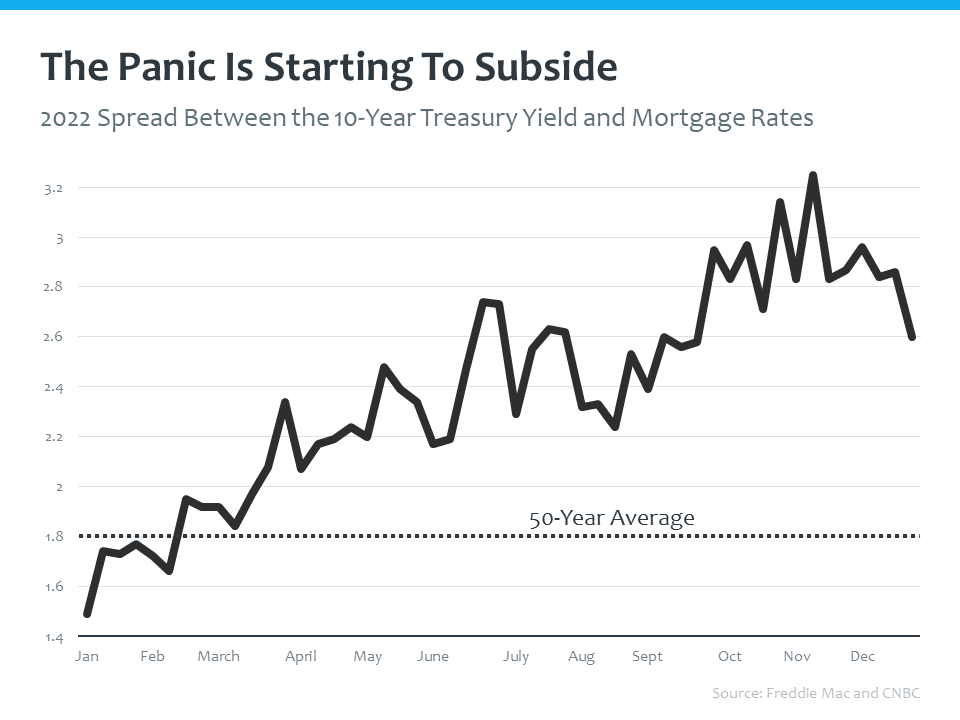
The short answer is that the spread between the 10-year treasury yield and the 30-year fixed mortgage rate is a measure of volatility and panic. However, that panic is starting to subside, which is good news for long-term interest rates.
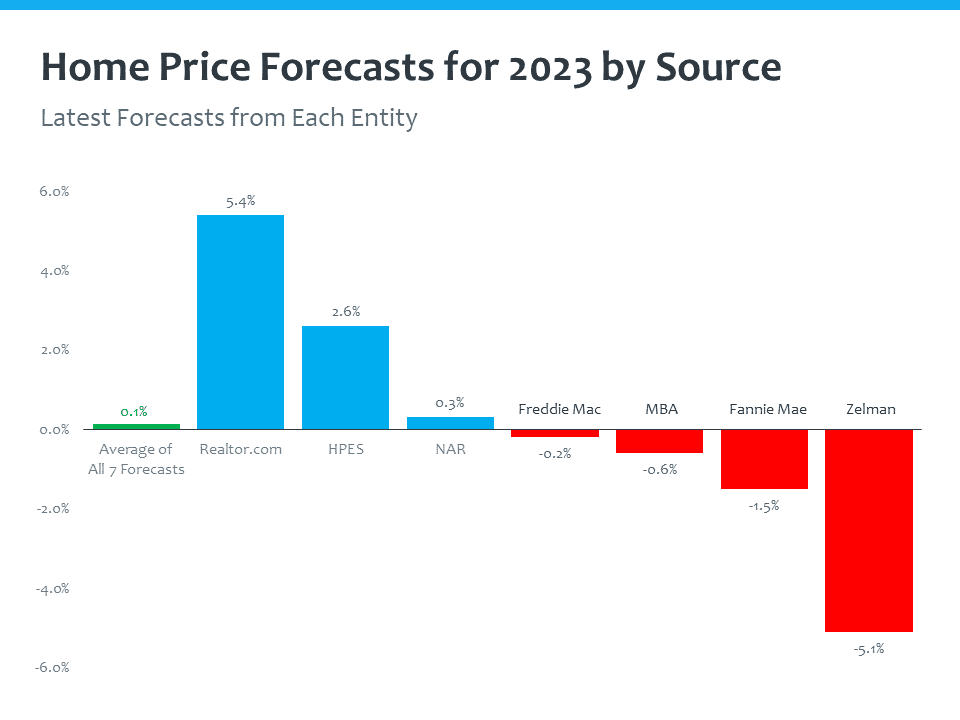
One of the biggest concerns for many is home prices. The one thing that is true right now about home price forecasts is that none of the experts agree. Forecasts for this year go anywhere from depreciation of 5% to appreciation of 5% - with an average of 0.1% appreciation.
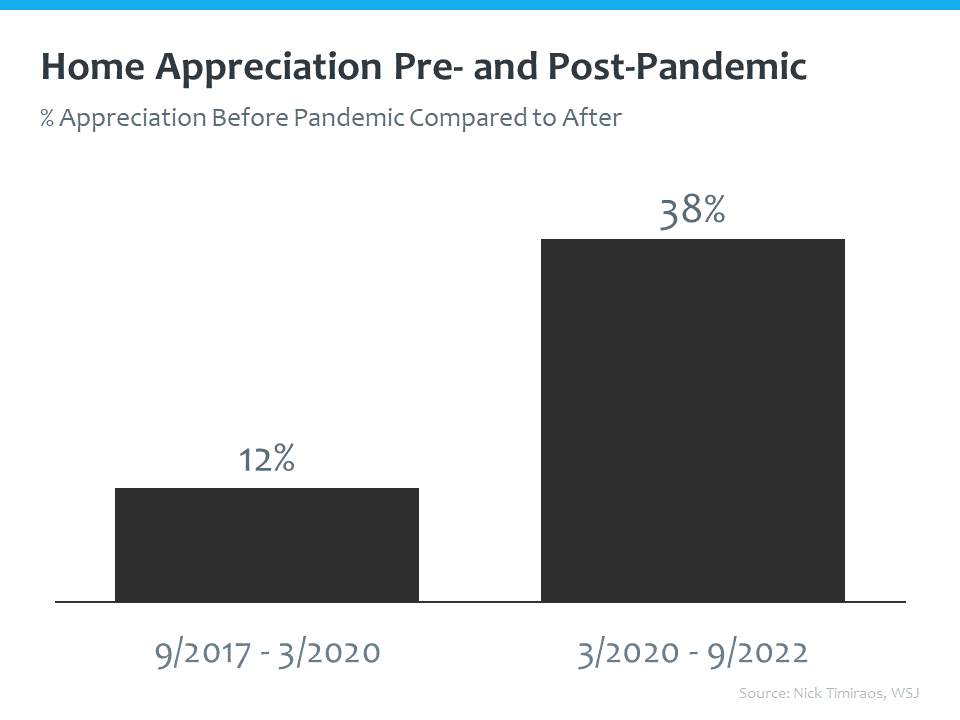
The Wall Street Journal recently looked at home price appreciation before the pandemic and after the pandemic. Before the pandemic, we saw about 12% home price appreciation. After the pandemic, a tremendous amount of appreciation across this country in residential real estate - 38%. But keep in mind that none of the experts are predicting a free fall in prices.
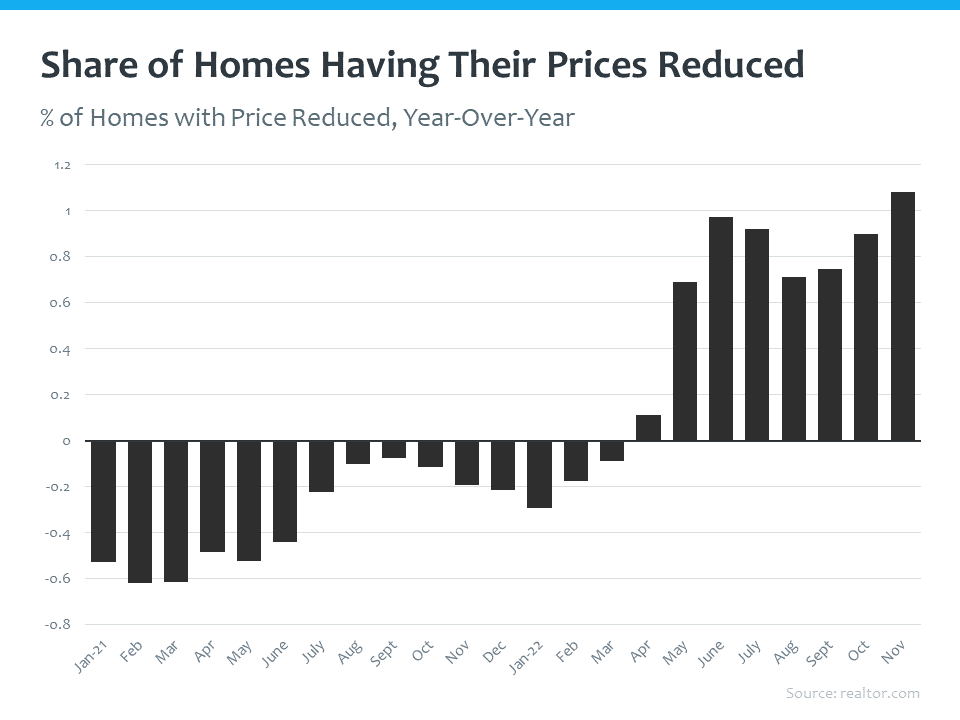
Just over 1% of homes had a price reduction according to the latest numbers. So again, not a free fall situation for home prices.
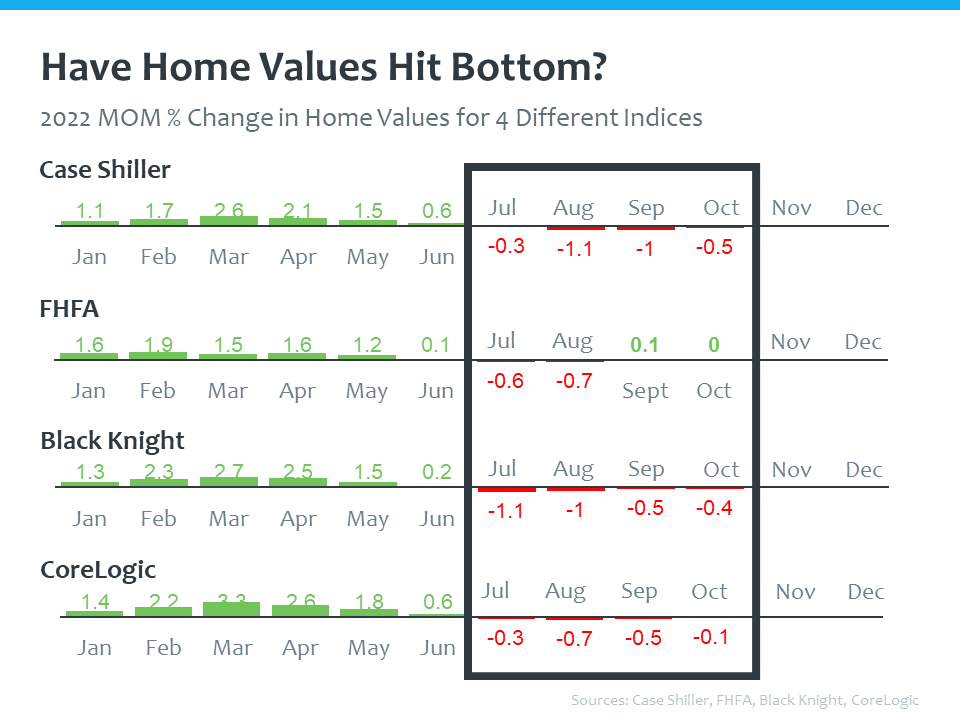
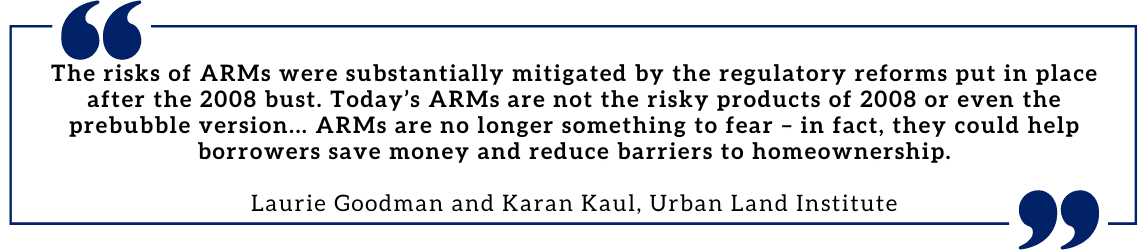
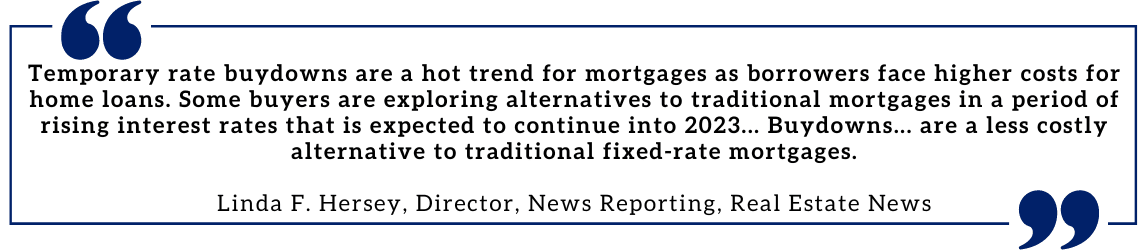
So, have home values hit their bottom? If we look at the month-over-month home value change, and isolate the last four months that have been published, depreciation peaked in August. We are not seeing a precipitous decline in home prices. Remember, as we see panic subside, we see more advantageous mortgage rates. Right now, financing like adjustable-rate mortgages and rate buydowns, can be very advantageous for those looking to buy.
Stay up to date on the latest real estate trends.

All Real Estate News
November 10, 2026

All Real Estate News
November 10, 2026

Local Events
November 7, 2026

Local Events
November 6, 2026

All Real Estate News
November 4, 2026

All Real Estate News
November 3, 2026
You’ve got questions and we can’t wait to answer them.