April 2023 Real Estate Market Update

April 17, 2023

All Real Estate News

A photo featuring the text "Happy April" with a background of pink tulips, suggesting a blog post or greeting for the month of April.

It's the demand-based rate environment that we are in. Today we've had several significant things happen in the economy and we sit now below 6.5% and certainly we're seeing a more positive rate environment, a good demand environment here for those that are out shopping.   https://www.mortgagenewsdaily.com/mortgage-rates


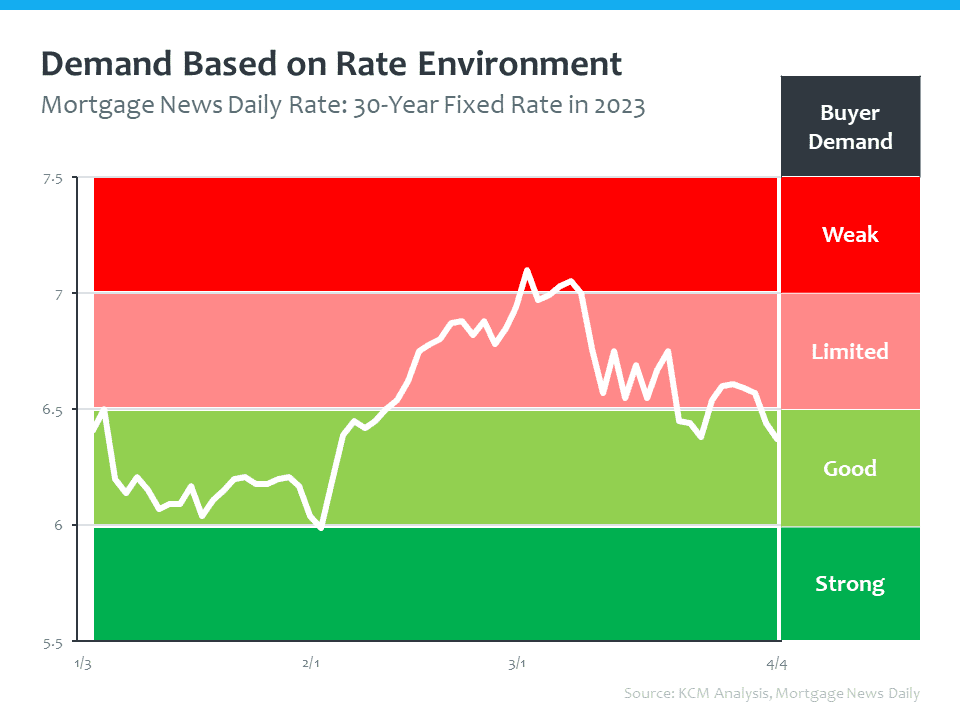
The demand-based rate environment we are in today is good – with economic changes having a positive effect on mortgage rates.


Turbulence in the financial markets is putting significant downward pressure on rates, which should benefit borrowers in the short-term.   Sam Khater, Chief Economist, Freddie Mac


It seems the turbulence in the secondary and banking markets is putting a downward pressure on mortgage rates, and as rates come down, it makes homes more affordable. However, mortgage rates aren’t the only thing that affect affordability. Wages and home prices are the two other factors that play into the affordability equation. We know wages have increased, so let’s take a look at home prices.


here's exactly what's happening with home prices. This is a Case-Shiller home price appreciation year over year look in the top 20 cities. You see a lot of green in the top 20 cities. You see some red there in West Coast cities, Portland, San Diego, San Francisco, Seattle. That's year over year comparing January of 2023 to January of 2022. The national number there you see in the upper right-hand corner of appreciation over the last year, 3.8%. Why is this so important? So important because it's nowhere near what all those headlines said in the fall, right? They said 20% depreciation. Sure, there are some markets that have seen depreciation. Yeah, a few West Coast based markets that are heavy tech markets right now, but it's not happening in the country. Certainly not the national average.   https://www.spglobal.com/spdji/en/indices/indicators/sp-corelogic-case-shiller-us-national-home-price-nsa-index/#news-research


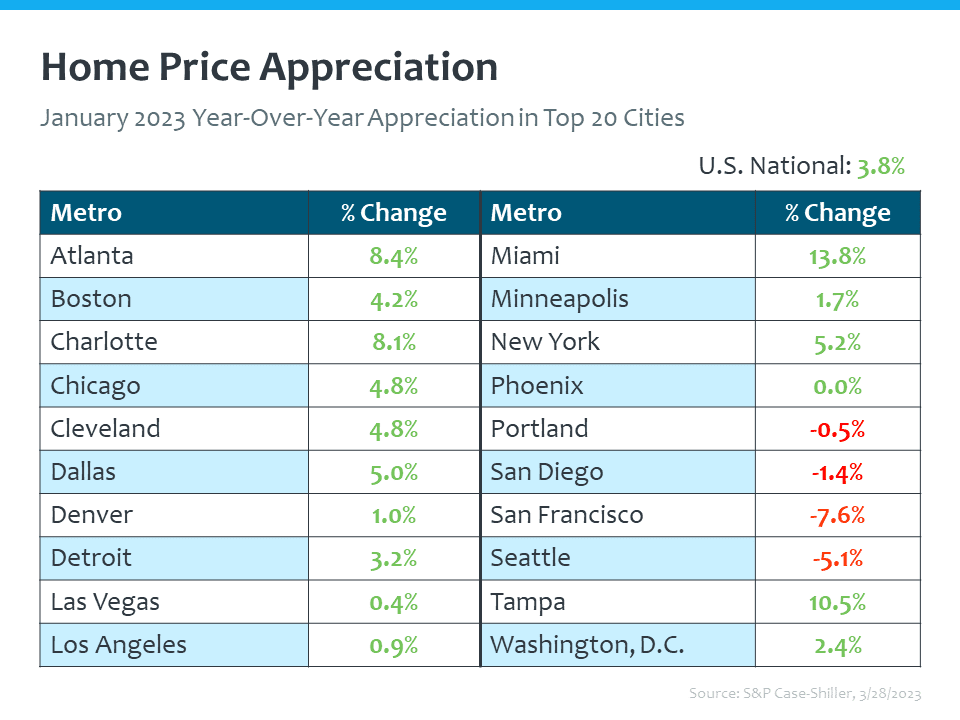
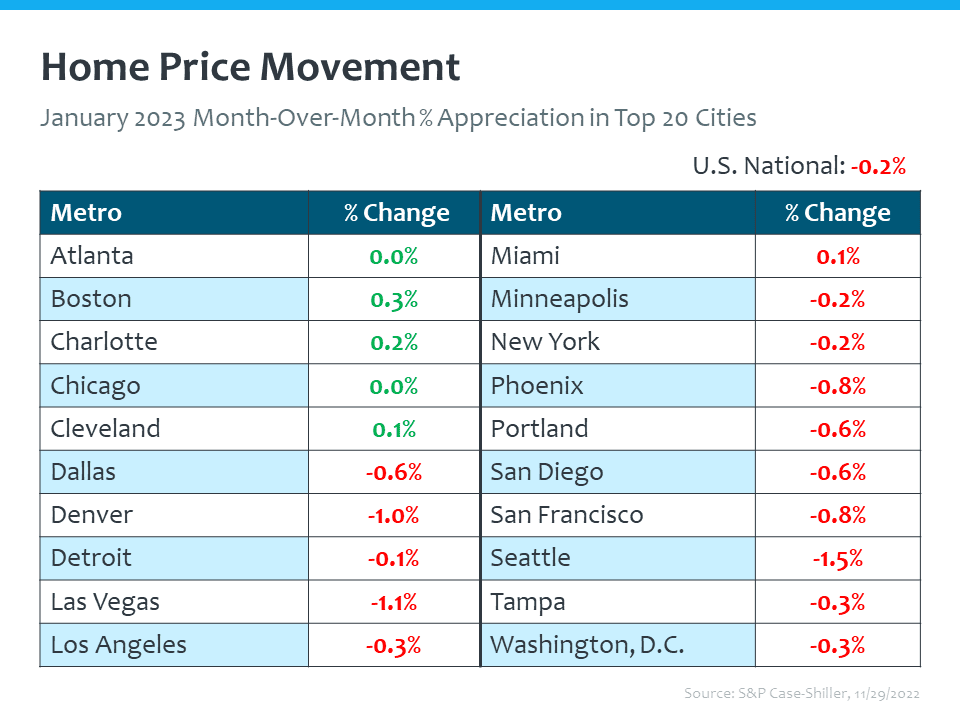
Nationally, home prices have appreciated 3.8% over the last year. Case-Shiller breaks down this appreciation in the top 20 cities, where the West Coast does seem to see some depreciation, while Florida cities are reporting the highest appreciation.


Declines in the West are due to the tech industry slowdown and a severe lack of affordability after decades of undersupply.   Selma Hepp, Chief Economist, CoreLogic


If we continue this look at year over year prices from FHFA, we see the same story. Pacific region being flat, every other region there January over January, appreciating their national rate of appreciation, 5.3%.   https://www.fhfa.gov/DataTools/Downloads/Pages/House-Price-Index.aspx


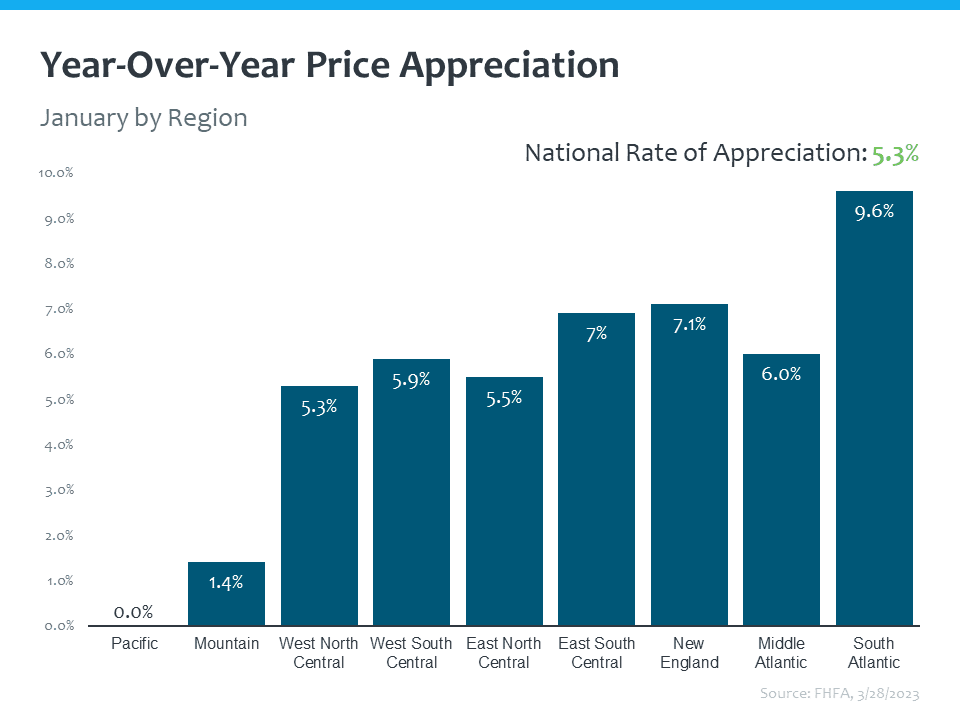
The Federal Housing Finance Agency reports a national rate of appreciation of 5.3% with the Pacific flat year-over-year, and the South Atlantic at 9.6%.


look at the month-over-month pricing, situation's a little bit different. And this is the same look from Case-Shiller month-over-month in January. This information runs a few months in arrears because it's same home sales. It's the best information you can get on pricing. And what do you see the overwhelming majority? Slight month-over-month depreciation, not this runaway scenario of depreciation. You see a few markets in the green, Atlanta, Boston, Charlotte, Chicago and Cleveland. Slight appreciation, the other slight depreciation. Okay, so that's month-over-month.   https://www.spglobal.com/spdji/en/indices/indicators/sp-corelogic-case-shiller-us-national-home-price-nsa-index/#news-research


However, if we were to look at the month-over-month data on pricing, the situation is a little bit different. According to Case-Shiller, we are seeing slight depreciation month-over-month. This is not a runaway scenario of depreciation, but depreciation none the less. Nationally, -0.2% depreciation overall.


If we look at the same with FHFA, we see sort of a mixed bag there as well. Some regions being down and some regions being up, some regions being flat.   https://www.fhfa.gov/DataTools/Downloads/Pages/House-Price-Index.aspx


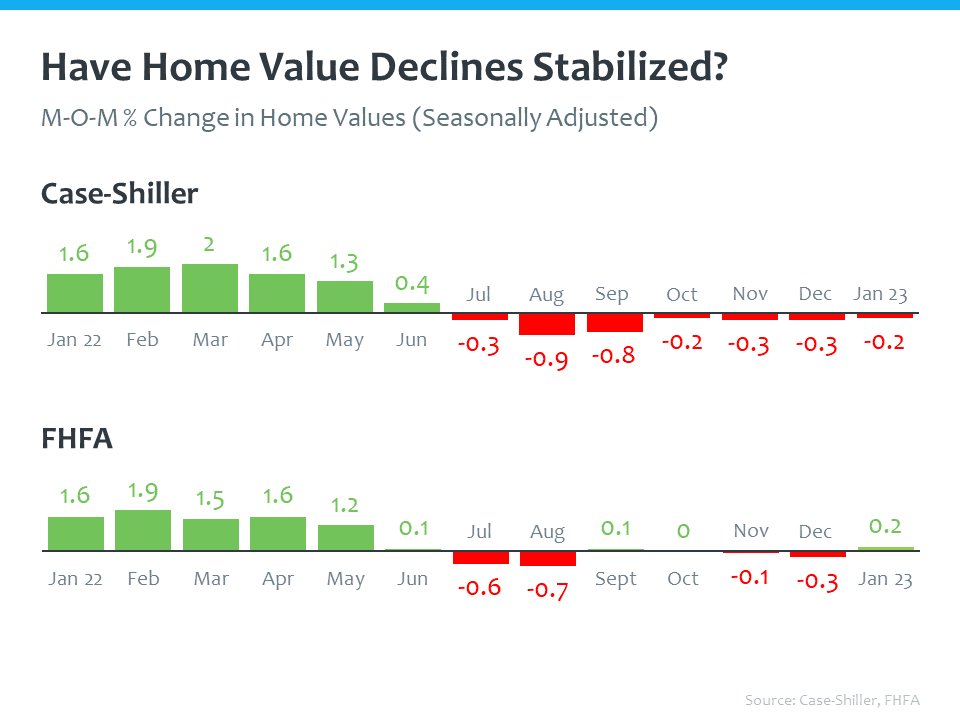
The Federal Housing Finance Agency shows a national average of 0.2% appreciation. Overall, it seems the worst depreciation is behind us.


This is month-over-month appreciation or depreciation from FHA and Case-Shiller going all the way back to January of last year. we start off the year in 2022. Great appreciation. Come to about the middle of the year in July and we start to see that turn happening, right. And most of the depreciation peaked in the fall in both of these graphics in August, September area and has stabilized and not taken these massive dips going forward since the fall. Why is this important? This is important to understand that prices in this country are not in a free fall. Home prices, no stretch of it.   https://www.spglobal.com/spdji/en/indices/indicators/sp-corelogic-case-shiller-us-national-home-price-nsa-index/#news-research https://www.fhfa.gov/DataTools/Downloads/Pages/House-Price-Index.aspx


Charting out both Case-Shiller and the Federal Housing Finance Agency data for home values month-over-month going back to January of last year, we can see that depreciation peaked in the fall and has stabilized. Prices are not in a free fall.


So this is showing, again, affordability is historically low. This is the same housing affordability index, but it zooms in on a month-over-month basis. So we can see January of 2022, no surprise, bar is higher, it was more affordable to buy a home before rates more than doubled last year. We saw that affordability decline throughout the year and now we see it moving in the right direction. We see it ticking back up. And the way that we break down this index put together by NAR, is we look at that dotted line across the screen. That's the threshold on the index, and it measures a score of 100. And what 100 means is that the home buyer making the median priced income can afford to purchase the median priced home. So if the bar is up above that threshold, homes are more affordable. If it's down below, then qualifying is more challenging and being able to afford a home is much more challenging. We've seen above and below that line over the past year, and we see it starting to tick back up. That January of 2023, that's the latest data we have on this. And that's when mortgage rates were in that 6 to 6.5% range. We saw them ease off their peak. Well, the good news is we're starting even over the past couple weeks, seeing mortgage rates ease back into those levels. That's largely due to the financial turbulence that we've seen in the market. So rate sensitive environment truly impacting affordability right now.   https://www.nar.realtor/research-and-statistics/housing-statistics/housing-affordability-index https://cdn.nar.realtor/sites/default/files/documents/hai-01-2023-housing-affordability-index-2023-03-10.pdf


Overall, affordability is historically low, according to the National Association of Realtors. In January of last year, it was more affordable to buy a home before rates more than doubled. Throughout the year, we saw affordability decline, and now we see it moving in the right direction. The dotted line is the threshold on the index (a score of 100). This threshold represents a home buyer making a median income being able to afford a median priced home. In other words, a score of over 100 means that homes are more affordable, and today we sit at 104.9.


monthly mortgage payments. At the end of the day, someone who's purchasing a home needs to be able to make their monthly payment. Bottom line, that's essential if they're going to buy a home. Now, that was much easier to do in January of 2021 when it was much more affordable to buy a home. We saw that creep up very significantly over the past couple of years. And the monthly mortgage payment, the media monthly mortgage payment, it peaked around October of last year. We saw much higher mortgage rates at that point. We had seen prices increasing. Well, now that we're seeing mortgage rates easing, we're seeing more neutral home prices, moderation in home prices, we're seeing wages increase. That monthly mortgage payment is coming back down, we're easing off that peak. So that's about a $200 difference since last October. And so when every percentage point counts in a mortgage rate, every dollar counts in a mortgage payment, this is really important news, really important information to be able to share with your clients so they can see how things are changing. Because if someone didn't qualify for a mortgage or couldn't afford that median monthly payment back last fall, maybe they can now.   https://cdn.nar.realtor/sites/default/files/documents/hai-01-2023-housing-affordability-index-2023-03-10.pdf


When it comes to affordability, monthly mortgage payments is what it all boils down to for the buyer. The median monthly mortgage payment, peaked around October of last year, according to the National Association of Realtors – down about $200 since last October.


It is much more expensive to purchase a home on the West Coast than it is in some of the other markets. So a median priced home, people on the West Coast on average, not making the income that it takes to qualify for a median priced home mortgage. That's really challenging in some of those markets. As we've seen prices accelerate more in some markets than others. This has been a bigger pain point in different regions of the country. Now if you look at places like the Midwest and the South, it's the opposite. So those making the medium price income should be able to qualify for a mortgage on the median priced home.  https://cdn.nar.realtor/sites/default/files/documents/hai-01-2023-housing-affordability-index-2023-03-10.pdf


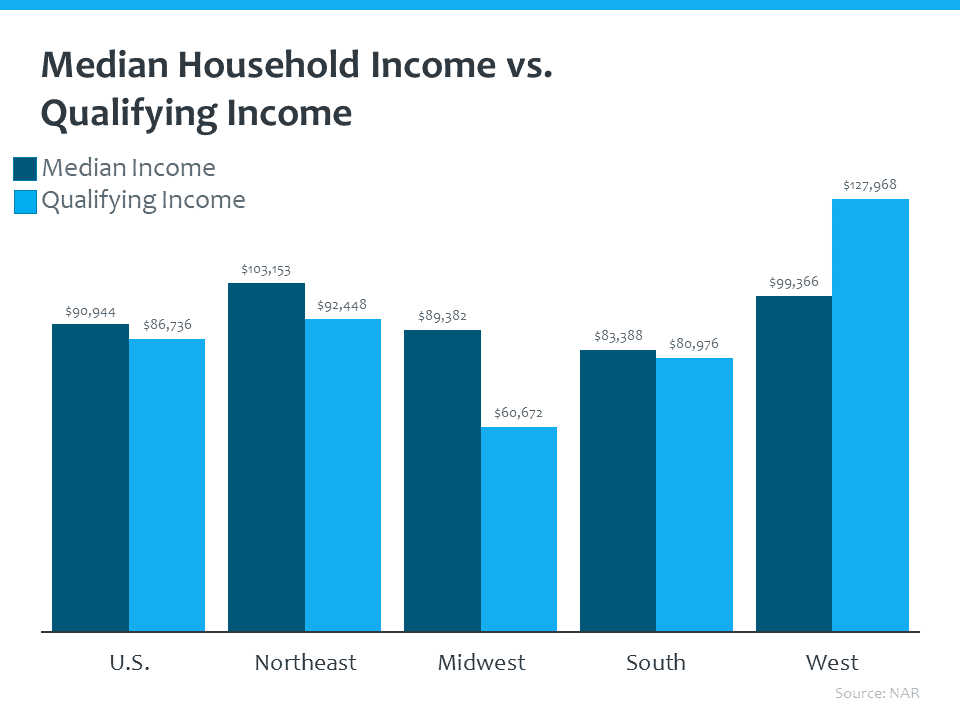
When discussing monthly mortgage payments, we would want to consider median household income versus qualifying income for a median priced home. According to the National Association of Realtors, it is much more expensive to purchase a home on the West Coast than it is in some of the other markets. So, on the West Coast individuals are not making the income that it takes to qualify for a median priced home. It’s the opposite in the Northeast, Midwest, and South. In these regions, those making a median income should be able to qualify for a mortgage on a median priced home.


this is the mortgage payment to income ratio, and it goes all the way back to 2000. This is put together by NAR and their recommendation is that when someone purchases a home, that they spend no more than 25% of their income on principle and interest. that 25% threshold. For a long period of time, time we were under that 25% threshold. Homes were more affordable and people could spend less than 25% of their income to purchase the median price home. Well, what do we know last fall? We ticked up above that threshold. So it became more challenging to buy a home. moving in the right direction, we've come down off that peak, underneath the threshold. Again, we are not out of the woods. It is still challenging and not as affordable to buy a home as it was a couple years ago, but we are moving in the right direction   Purchased data from NAR https://cdn.nar.realtor/sites/default/files/documents/hai-01-2023-housing-affordability-index-2023-03-10.pdf


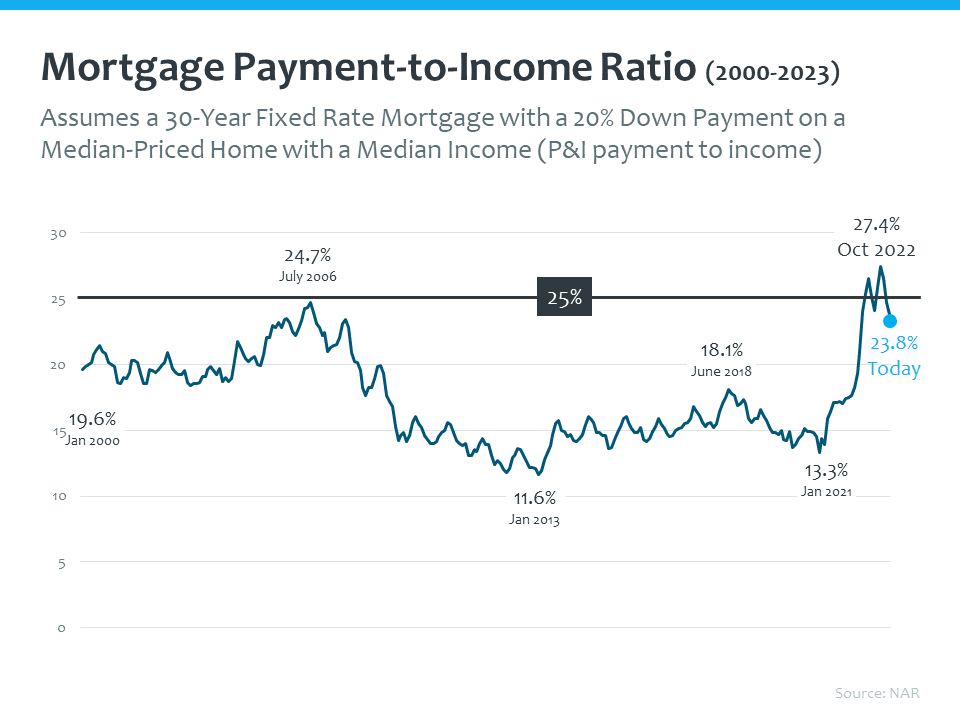
It is recommended by the National Association of Realtors, that no more than 25% of a household’s income should be spent on principle and interest. Looking as far back as January of 2000, we were under that 25% threshold for a long time. While we saw a historic high of 27.4% in October, we sit below the threshold now at 23.8%. Affordability is moving in the right direction.

Follow Us on Instagram

Let’s Talk

You’ve got questions and we can’t wait to answer them.