December 2022 Real Estate Market Update
December 29, 2022
Monthly Market Updates

December 29, 2022
Monthly Market Updates
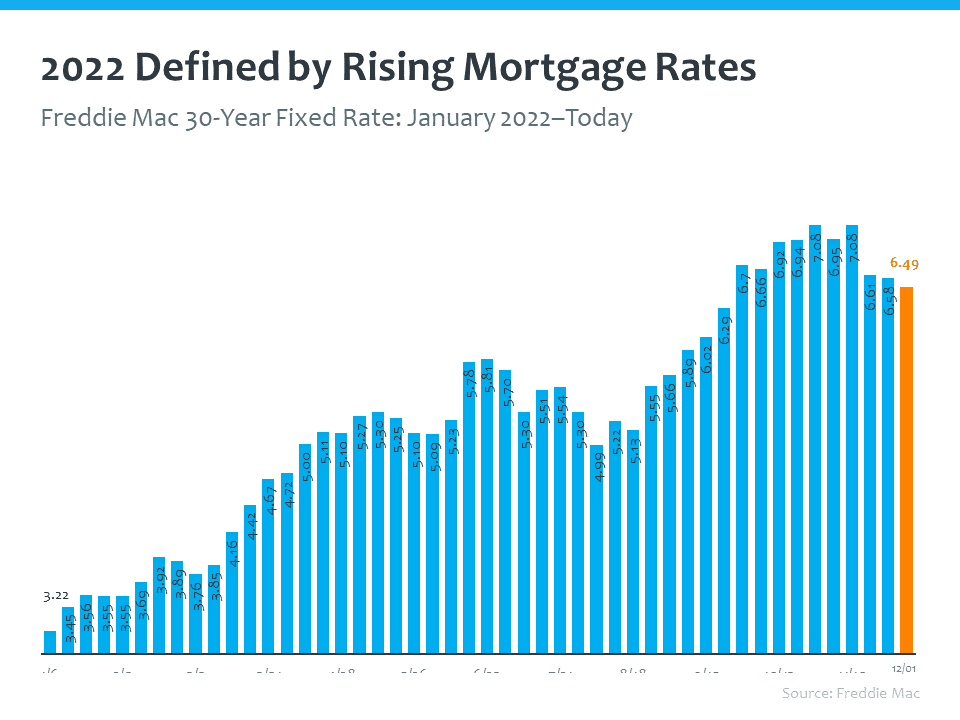
This year mortgage rates made history. Never has the average 30-year fixed mortgage rate doubled in one year since we began tracking them 50 years ago. This anomaly is largely due to inflation, and the future of interest rates will likely be determined by the Fed’s ability to control inflation.
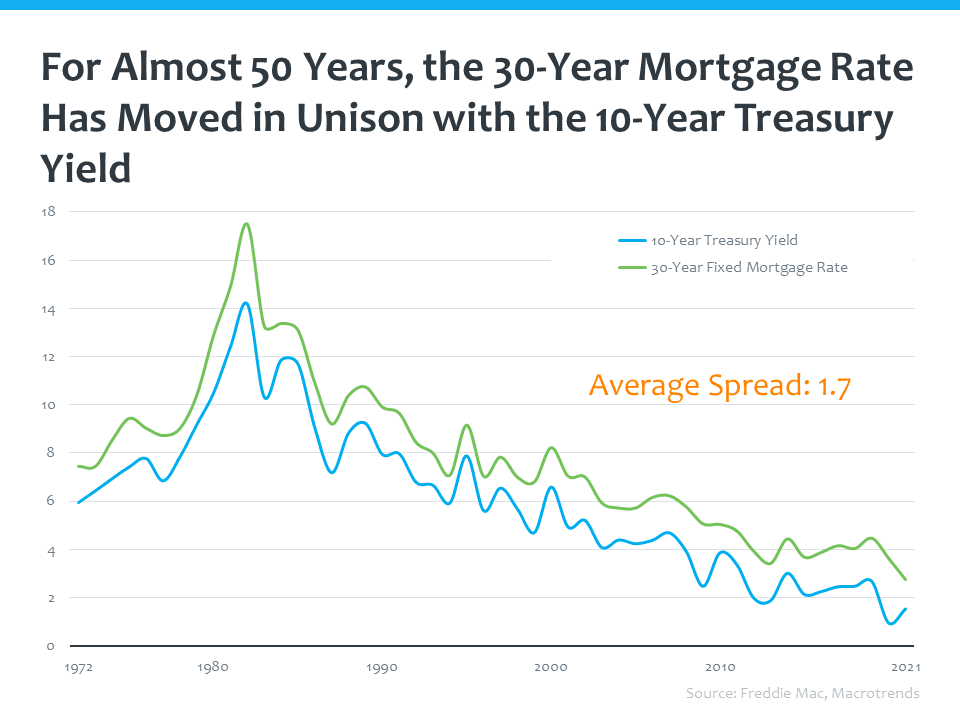
For almost 50 years, the 30-year fixed mortgage rate has moved in unison with the 10-year Treasury yield. So, if you want to know where mortgage rates are heading, watch the 10-year Treasury yield and the spread between them (about 1.7% or 170 basis points). If you take the 10-year Treasury, and add 1.7% to it, you would likely get the 30-year mortgage rate.
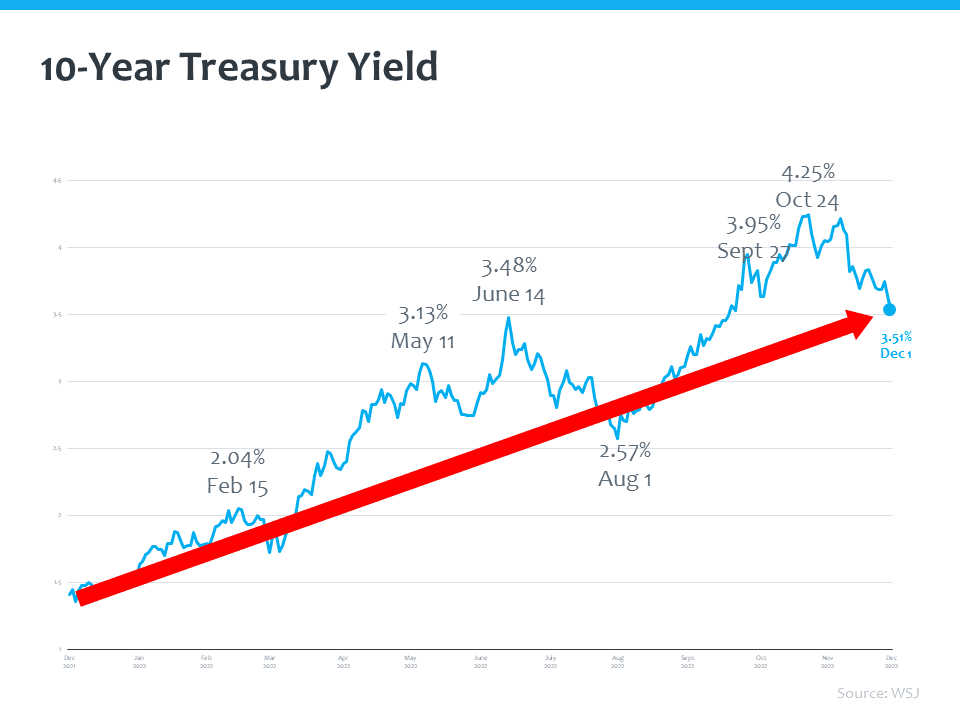
The 10-year Treasury has been rising.
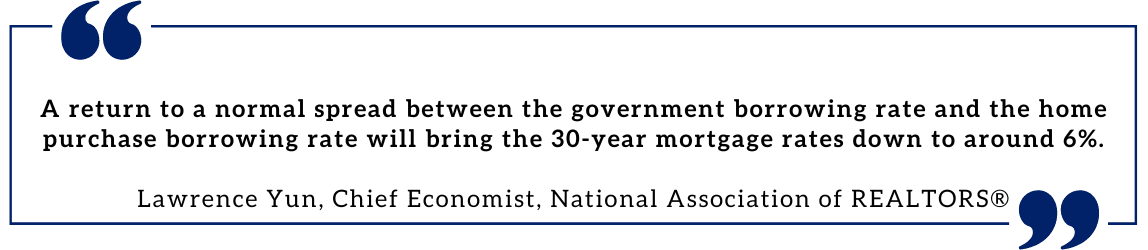
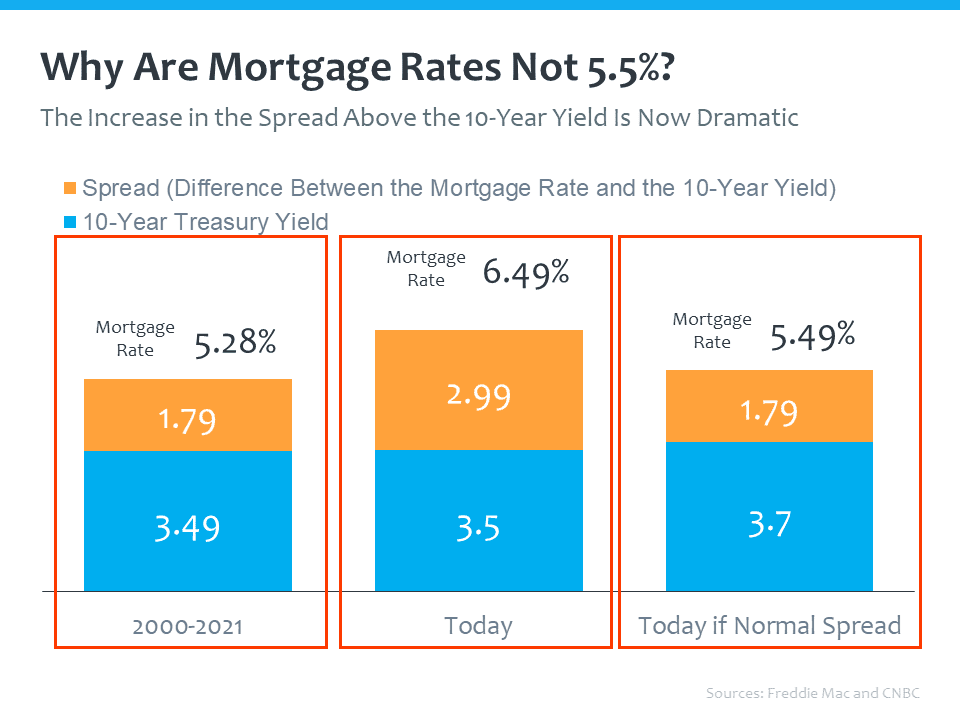
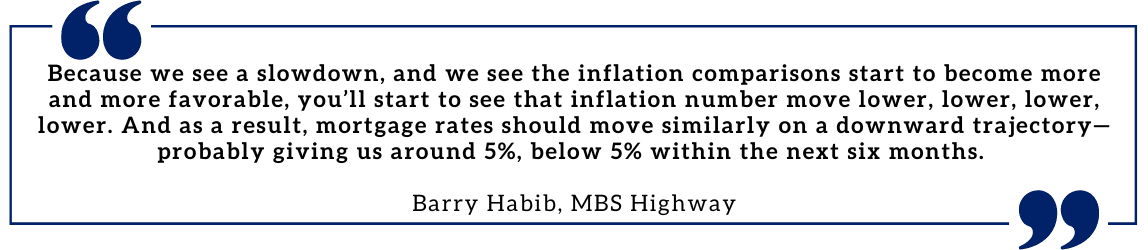
However, the market has been abnormal, and we are looking forward to the “return to a normal spread” – the spread between the 10-year Treasury and the 30-year fixed rate. Going back to 2000, the average spread is 1.79%; where the mortgage rate is 5.28% and the 10-year Treasury is 3.49%. Today’s spread is almost 3%. Why? Market volatility is driving rates higher, and the investors that determine these rates know that everybody that's buying right now will refinance these mortgages, and so they're charging a premium for them. Mortgage rates will come down as we go into next year and we get inflation under control.
So, what are the experts saying about rates as we go into next year?
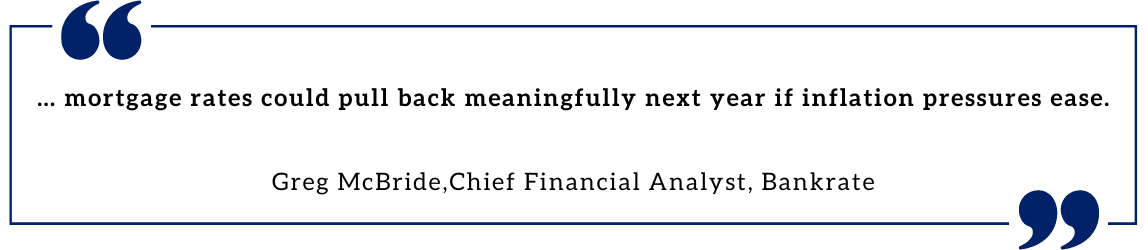
We're in an uncertain market. There's a lot of volatility and a lot of questions on the economy, on geopolitical events, and on the war in the Ukraine. As we move into next year, we want to see some of that get eliminated, and inflation to get under control. Rates will likely be in the high fives, low sixes.
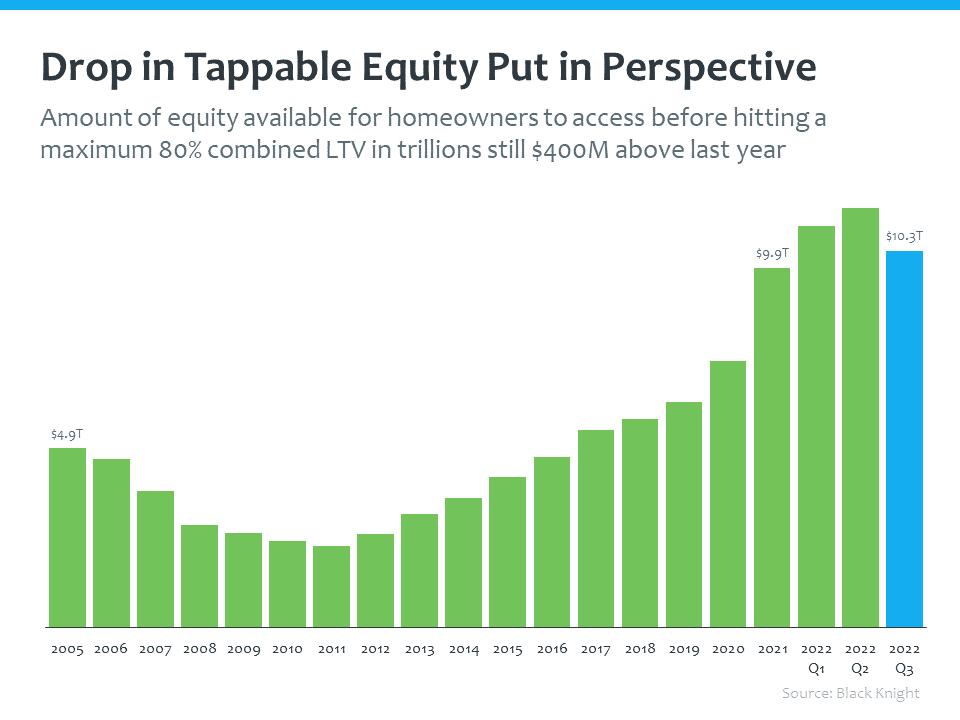
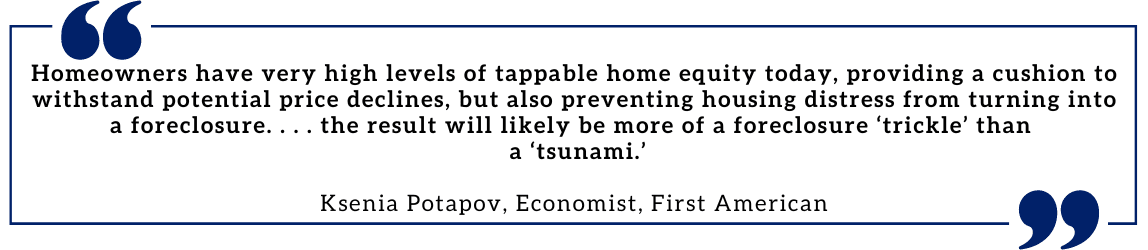
Now, more than ever, it is important to put the terrifying headlines into perspective. For example, Diana Olick published a tweet, "Homeowners have lost 1.5 trillion in equity since May as home prices dropped." This is factually accurate, and comes from a Black Knight study, but doesn’t touch on the fact that we have more tappable equity than we had in the past. Although equity has dropped, it is still an extremely large figure.
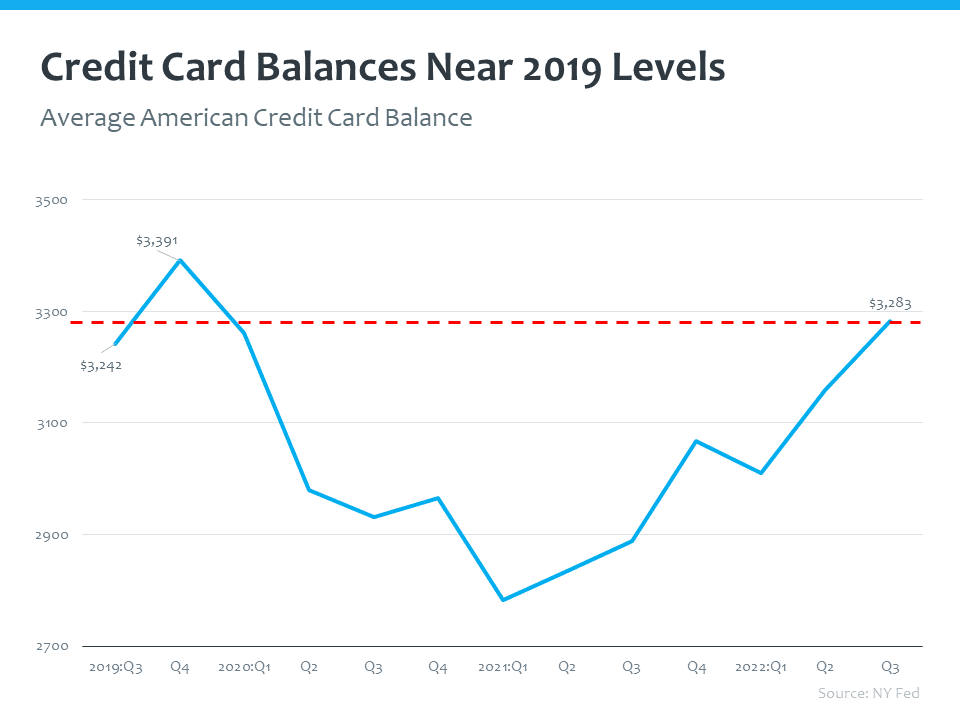
Another scary headline from CNBC said, "Household debt soars at the fastest pace in 15 years as credit card uses surge, the Fed Report said." Although this is in reference to credit cards, that could be a factor that leads to delinquencies in a mortgage. Again, this is very explainable. During the pandemic, stimulus money and loans caused savings rates to jump. People weren't using their credit cards. Now, people are again borrowing and using credit cards. Liberty Street Economics, the blog of the New York Fed, said, "Though delinquency rates are rising, they remain low by historical standards, and suggest consumers are managing their finances through this period of increasing prices."
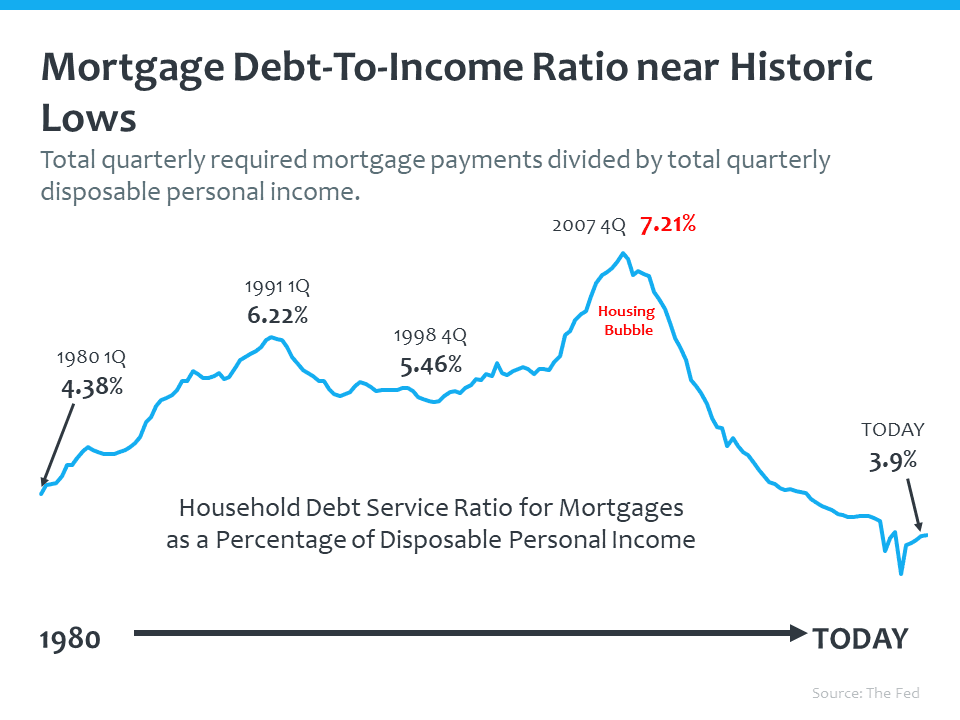
Let’s take a look at the Fed’s household debt service ratio for mortgages as a percent of disposable income. Today we are at 3.9% – considerably low when we look back at the '80s, '90s, and 2000s. Having all the information, is critical right now.
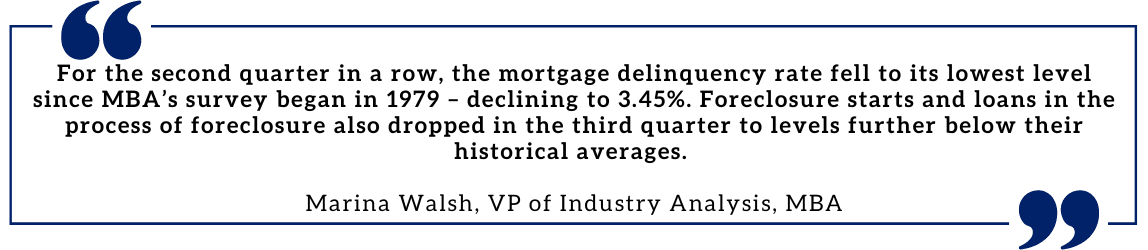
Delinquencies are lower than what they've been in a long, long time. Homeowners have options today – they can sell their home, pay a commission, put a little bit of money in their pocket, and move to the other side of the financial crisis they're facing.
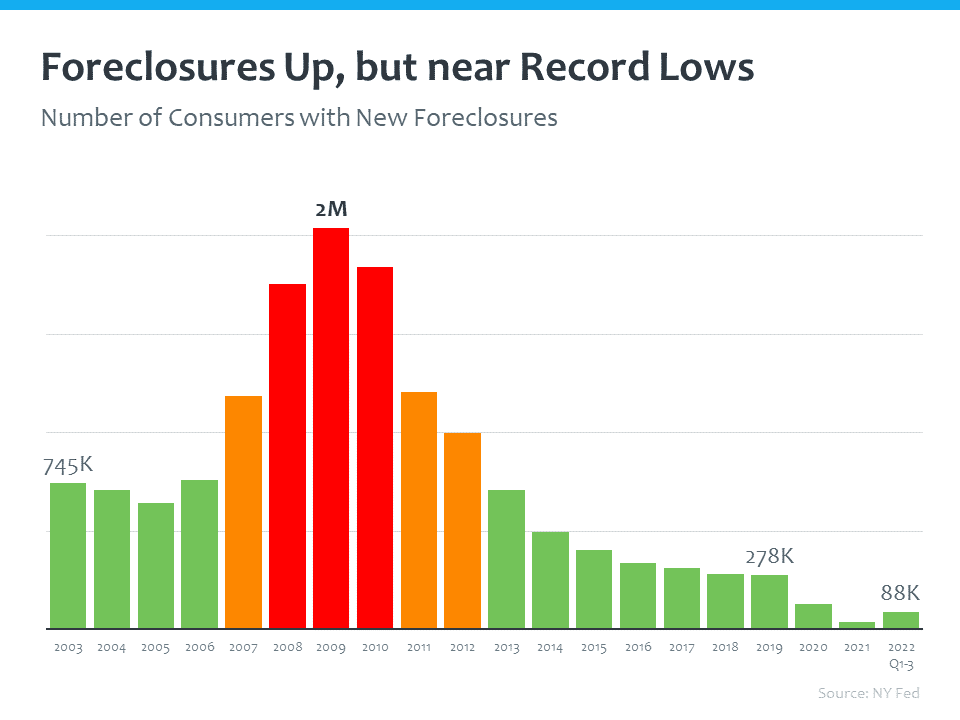
While foreclosures are up this year, they're at near record lows. As of the third quarter, there have been 88,000 foreclosures in this country. In 2019, there were 278,000 foreclosures.
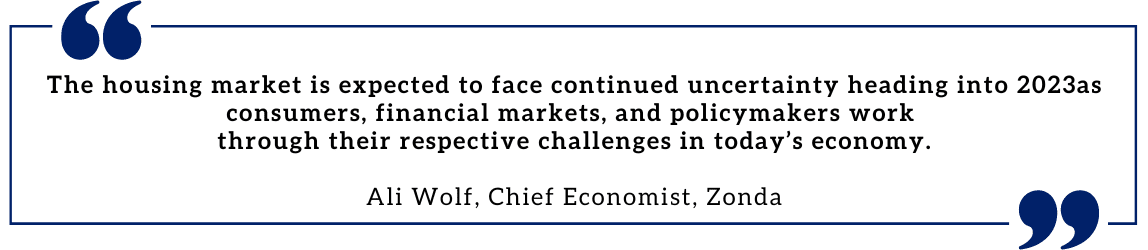
Before taking a look at the housing market forecast for 2023, let’s look back at 2022 – a market defined by inflation and rapidly rising mortgage rates. The Federal Reserve is still making moves to lower inflation, and where that lands is really going to impact what happens with the housing market next year – a year that will be defined by stability.
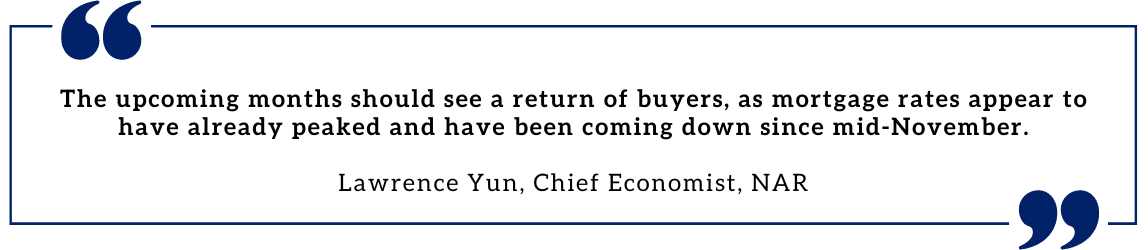
The Freddie Mac 30-year fixed has risen drastically this year, and that has had an impact on the balance of the housing market. It has slowed buyer demand. It has slowed the pace of sales. In order to determine where mortgage rates are headed, we need to continue to watch inflation. As inflation is high, mortgage rates tend to be high.
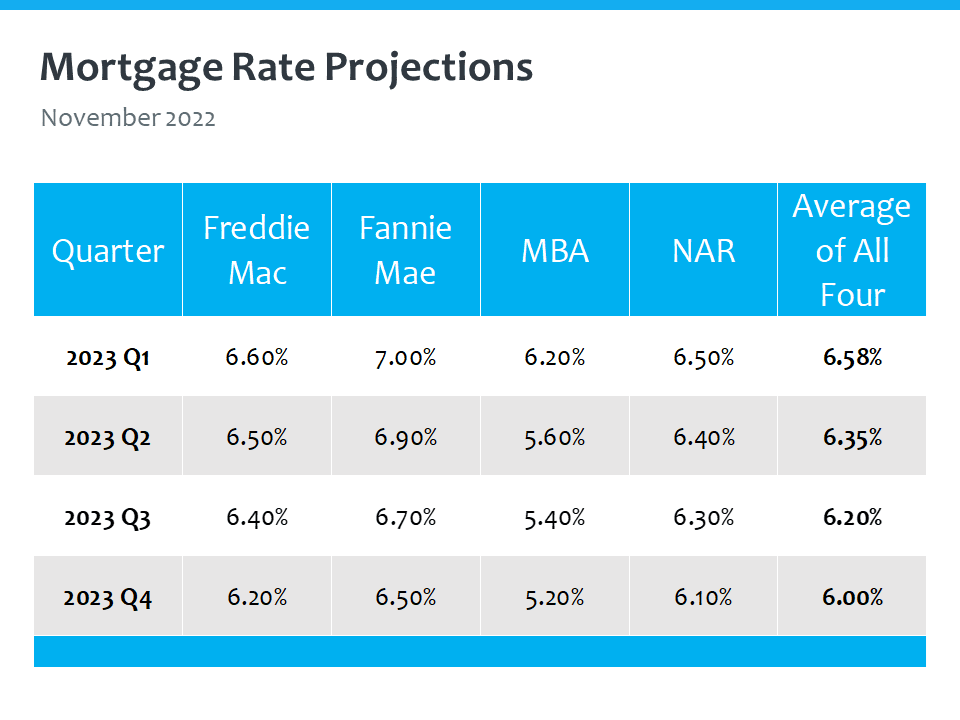
Averaging Freddie Mac, Fannie Mae, the Mortgage Bankers Association, and the National Association of REALTORS®, we should see about 6.25% next year.
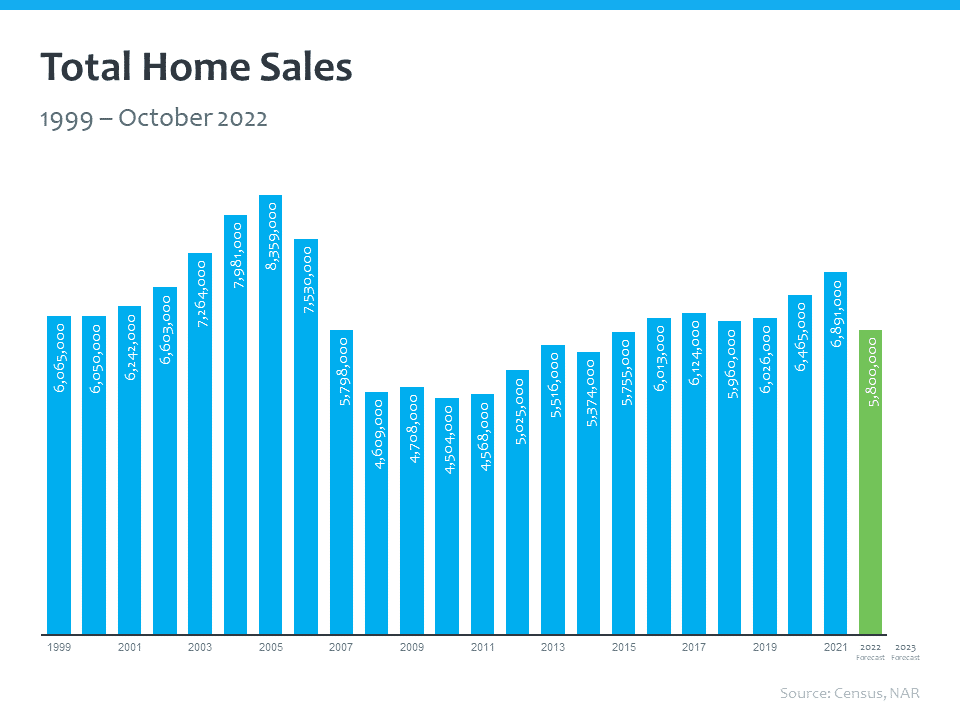
Total home sales for this year is about 5.8 million. We sold roughly 6.9 million homes last year. It feels a lot slower coming off that high of 2020 and 2021.
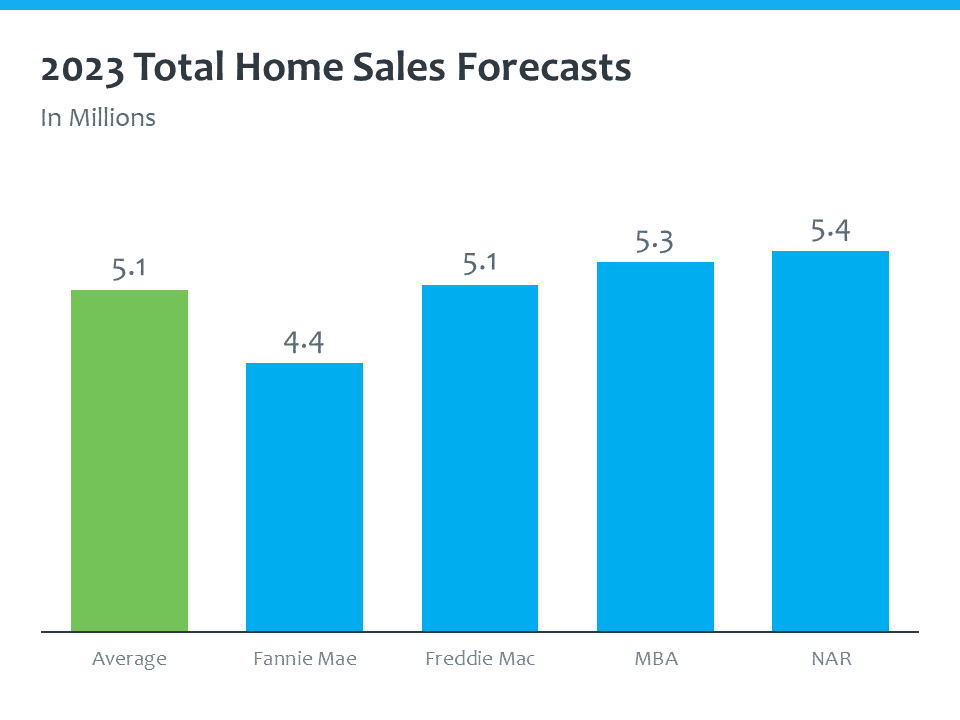
Next year is projected to have 5.1 million home sales. However, this is based on today’s high inflation and mortgage rates. As the Fed continues to work on getting inflation under control, this projection will likely be increased.
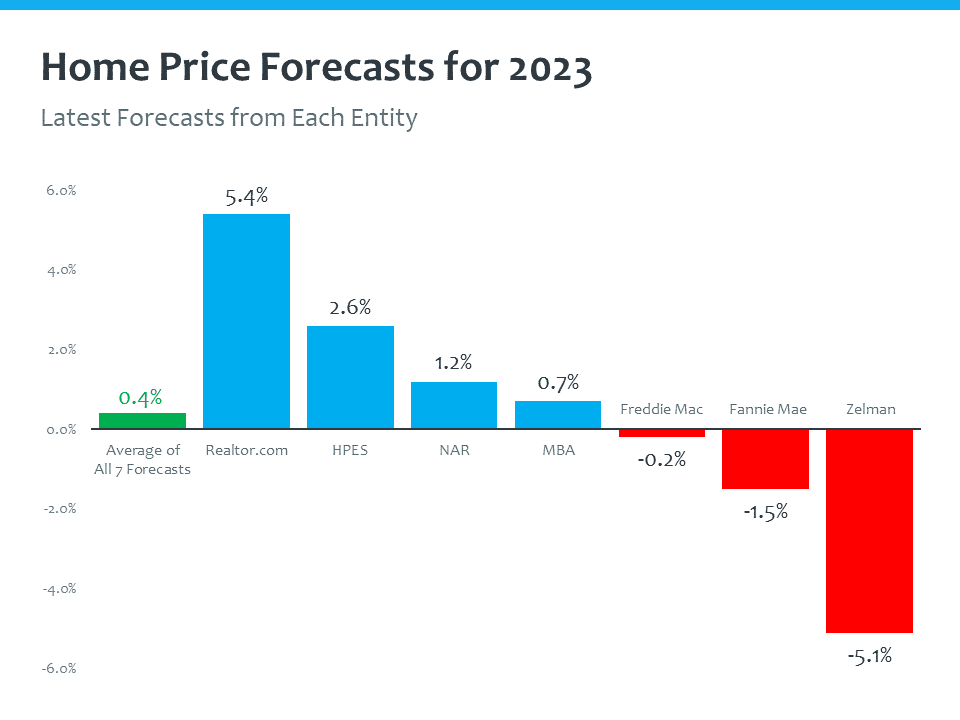
Experts are also predicting home prices to appreciate a little bit next year. Coming off a point in time earlier this year where we had 20% year-over-year home price appreciation, we are looking at an average of just 0.4% next year. This is all about supply and demand. The more buyers we have in the market, the more home prices will rise. So, as we look into next year, we're really looking at flat or neutral home price appreciation that will vary by market.
The market is looking for stability in 2023. We're looking for mortgage rates to stabilize and become more predictable. We're watching the economic drivers around us, and we're still seeing demographic demand that is going to drive the housing market forward.
Stay up to date on the latest real estate trends.

All Real Estate News
November 11, 2026

All Real Estate News
November 10, 2026

All Real Estate News
November 10, 2026

Local Events
November 7, 2026

Local Events
November 6, 2026
All Real Estate News
November 4, 2026
You’ve got questions and we can’t wait to answer them.