July 2023 Real Estate Market Update
July 10, 2023
All Real Estate News

July 10, 2023
All Real Estate News
Despite many gloomy forecasts from earlier this year, the residential real estate market has returned to more typical, seasonal trends as buyer demand has improved. As we delve into the numbers, it is important to remember we are coming out of a time that was not only unprecedented for real estate, but for the world – especially on the personal health and economic fronts.
However, housing is normalizing. We're seeing that normalization show up in demand. We are seeing that normalization show up in prices. We are seeing that normalization show up in a return of seasonality – trending up in spring with a buildup towards the summer and a slowdown during the fall and winter months. Most importantly, we're also seeing prices rebounding. By and large, we're seeing a market moving toward a new normal. However, there is a reality check to some of the good news.
Supply has been constrained, and we are experiencing higher mortgage rates. As a result, we are seeing prices beginning to rise again, which really makes affordability a primary challenge. However, there is a silver lining to that reality check – new construction is growing, which is offering more options for buyers and sellers.
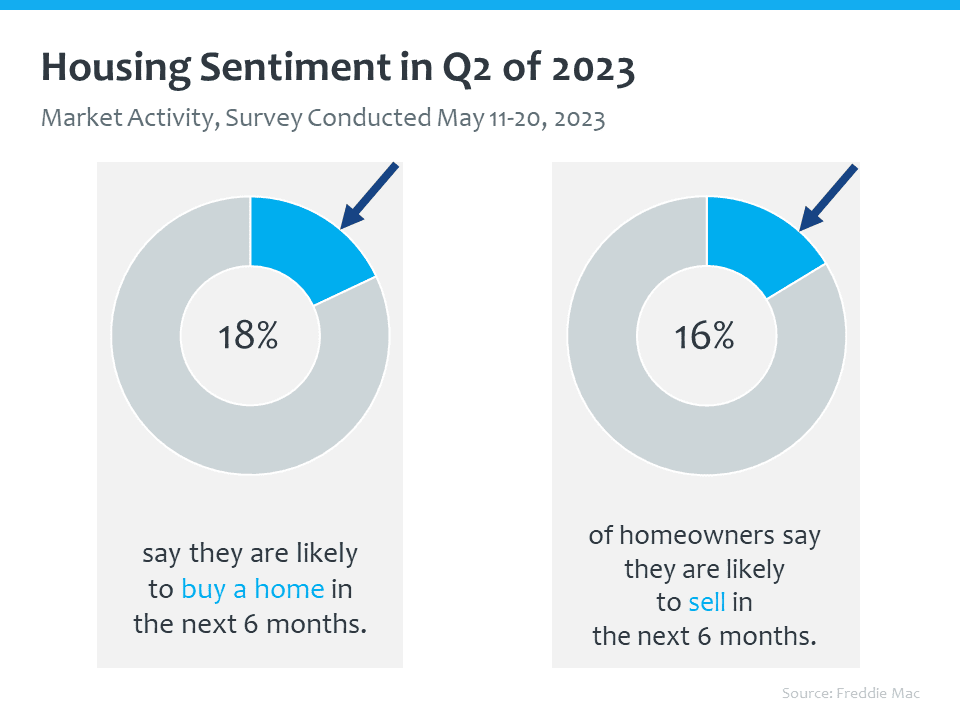
We've seen buyer demand return to market after about six to seven months in 2022 in which rising mortgage rates scared off a lot of folks from the market, and they pulled back. In the second half of this year, Freddie Mac conducted a survey of buyers and sellers, and they found that 18% of Americans said they are likely to buy a home in the next six months. That number is significant in any given year, since the normal share of people buying a home runs about 8% to 10%. At the same time, 16% of Americans who own their home, said they are likely to sell in the next six months. These are really solid indicators of a market that is returning to a more typical, seasonal trend, and towards a more active market.
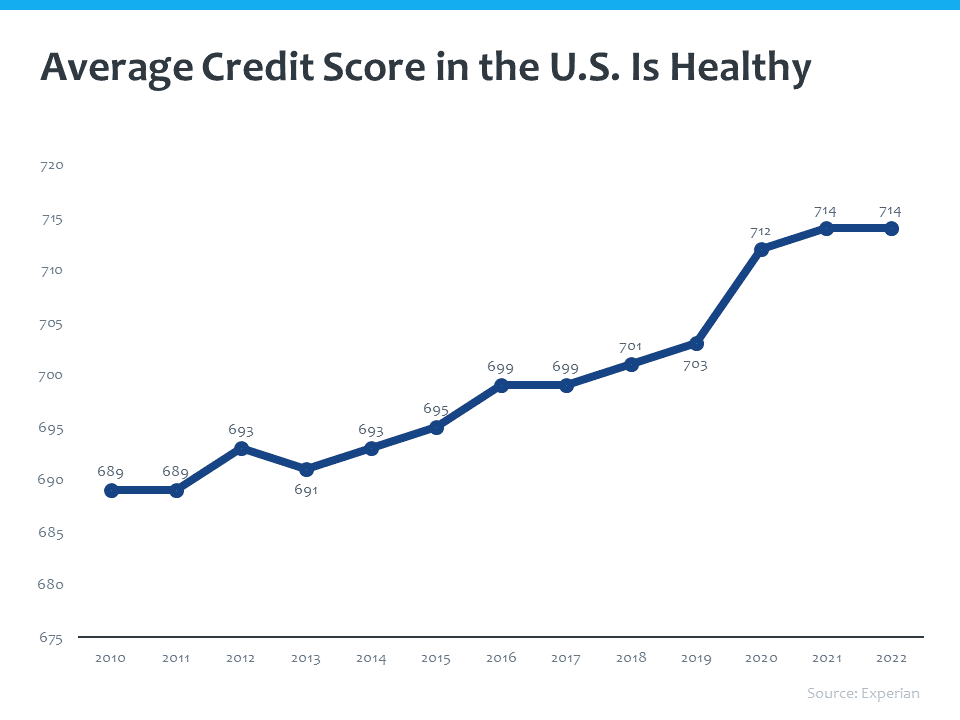
In addition, buyers are coming to market in much stronger financial shape. According to Experian, the average credit score of typical American consumer, going all the way back to 2010, has grown from 689 to 714. So, a strong economy, strong savings rates, and a strong ability to weather financial challenges have meant that credit scores are at all-time highs. According to the New York Fed, the median score of Americans taking out a mortgage was 765 – even higher than the typical American consumer, and a very good sign for a housing market moving toward a new normal.
In addition, we've had 10 months of mortgage rates moving mostly in a well-confined range – between 6% and 7%, which is quite possibly the new normal. We find that more and more buyers are no longer asking, "Can I afford to buy a house," they're now asking, "How can I make the numbers work, so I can purchase a home?" Again, another sign of normalizing markets.
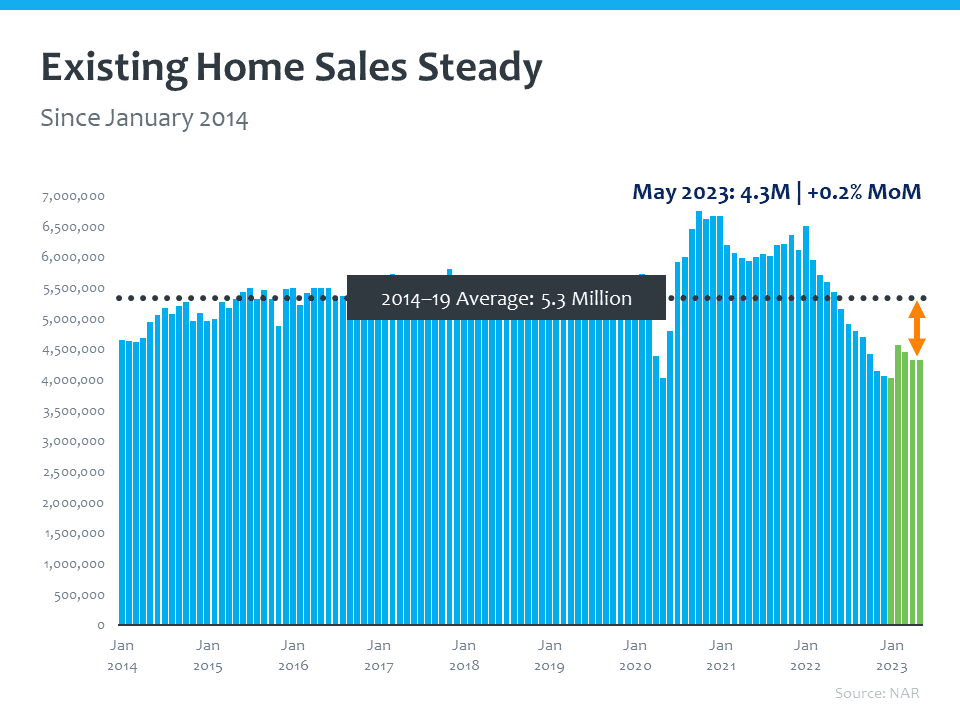
Relatively steady rates have led to several consecutive months of consistent home sales.
As of the latest numbers, we’re running at a 4.3 million (annualized) pace of sales, with a steady month-over-month increase. We are below the long-term average of about 5.3 million, but we're seeing is a much steadier market.
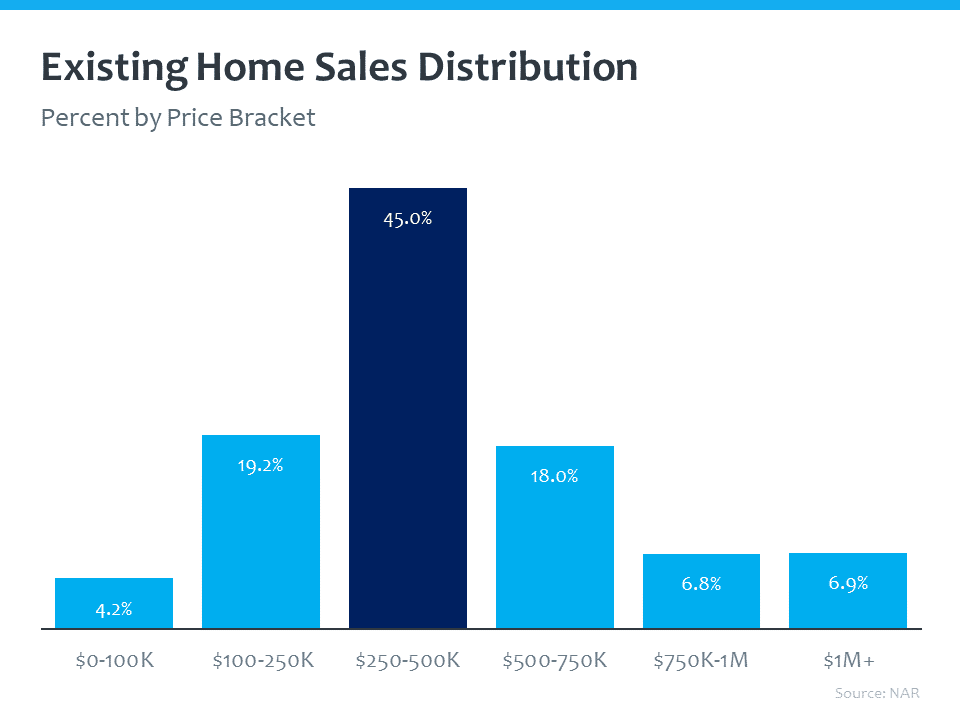
When we look at home sales across price buckets, you can see that the bulk of sales are taking place in that mid-range of the market, $250,000 to $500,000, which is really the more affordable part of the market.
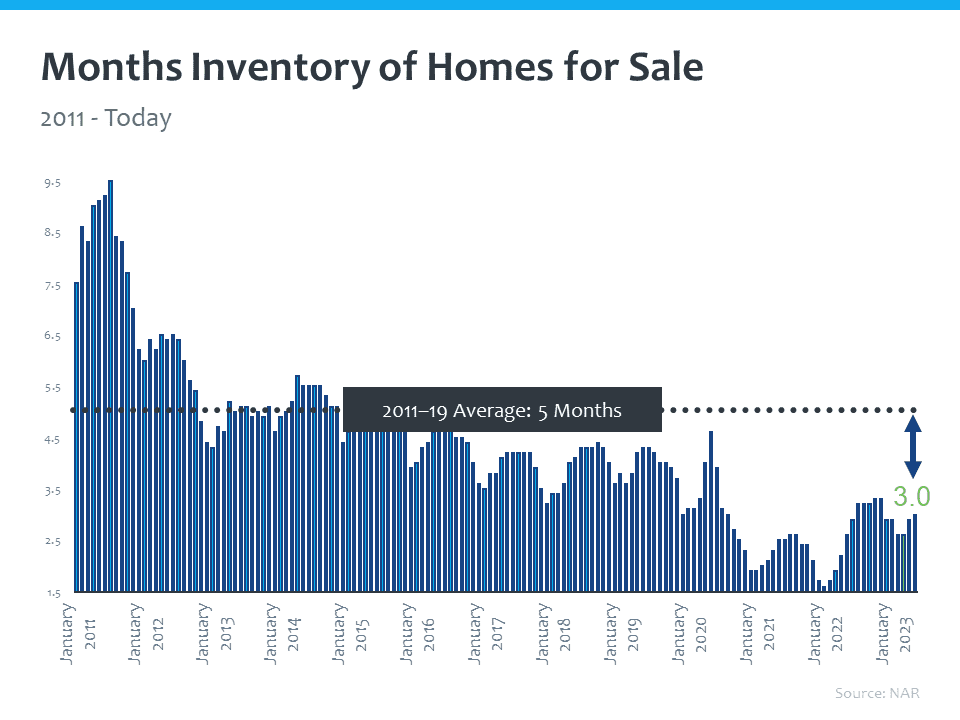
When you look at the average month supply for the 2011 to 2019 period, you see it's roughly about five months – a balanced market. As of the latest figures, we are at a three-month supply – quite a bit short of a balanced market.
On the other hand, housing supply is improving, but remains limited.
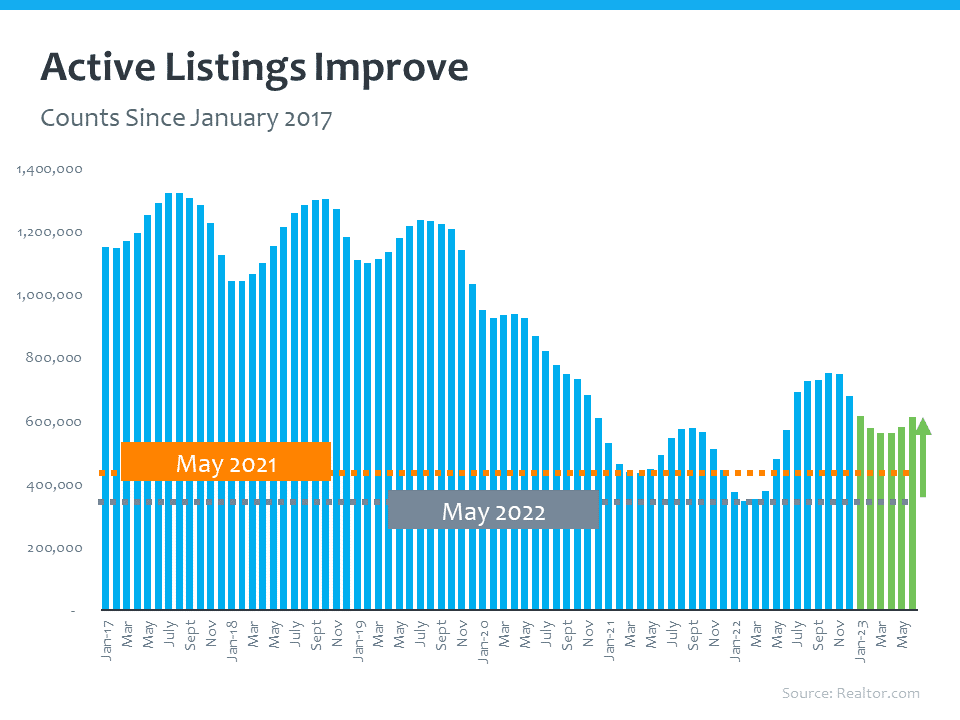
We are seeing more active listings, than we did in the same months in 2021 and 2022, allowing buyers more options.
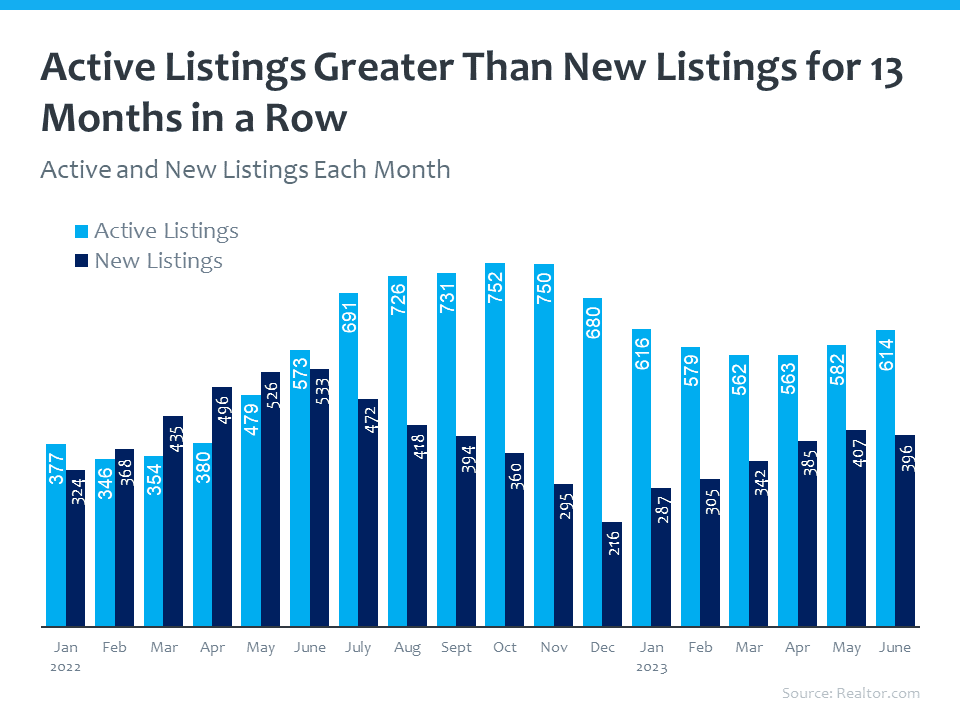
Active listings have been greater than new listings for 13 months in a row. So, even with growth in active listings, what's really keeping the market back are new listings. Perhaps, homeowners ready to move forward but not feeling confident enough in the current market to do so.
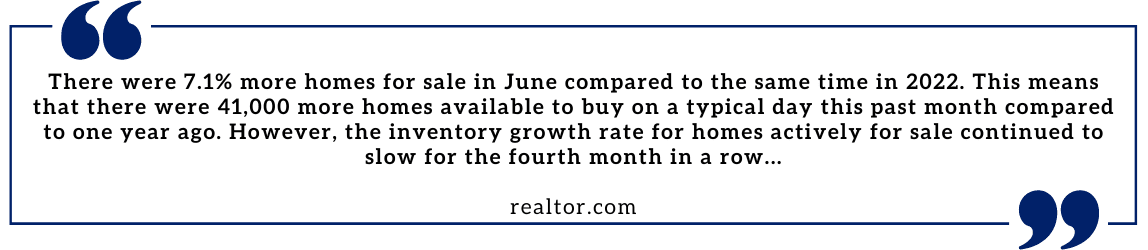
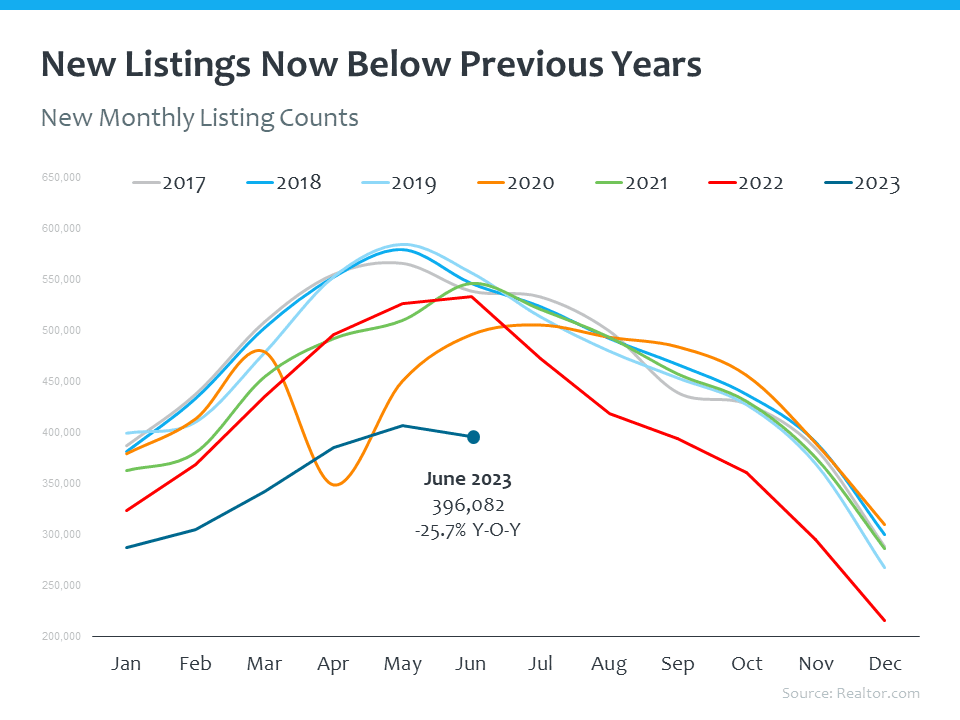
realtor.com points out that in June, the number of homes newly listed for sale declined by 25.7% compared to the same time last year, and new listings remained almost 28% below pre-pandemic levels. The pace of new home listings year-to-date is 16.4% lower than in the first half of 2020 when the real estate market was contending with pandemic closures, restrictions, and uncertainties.
New listings this year lag by quite a significant margin compared to the prior six years. But, here is a great representation of the return of seasonality. Home begin to come to market starting in February, with a peak around May, and the decline beginning in June.
The rebound in home prices confounds a lot of the headlines which called for a major correction and decline in prices.
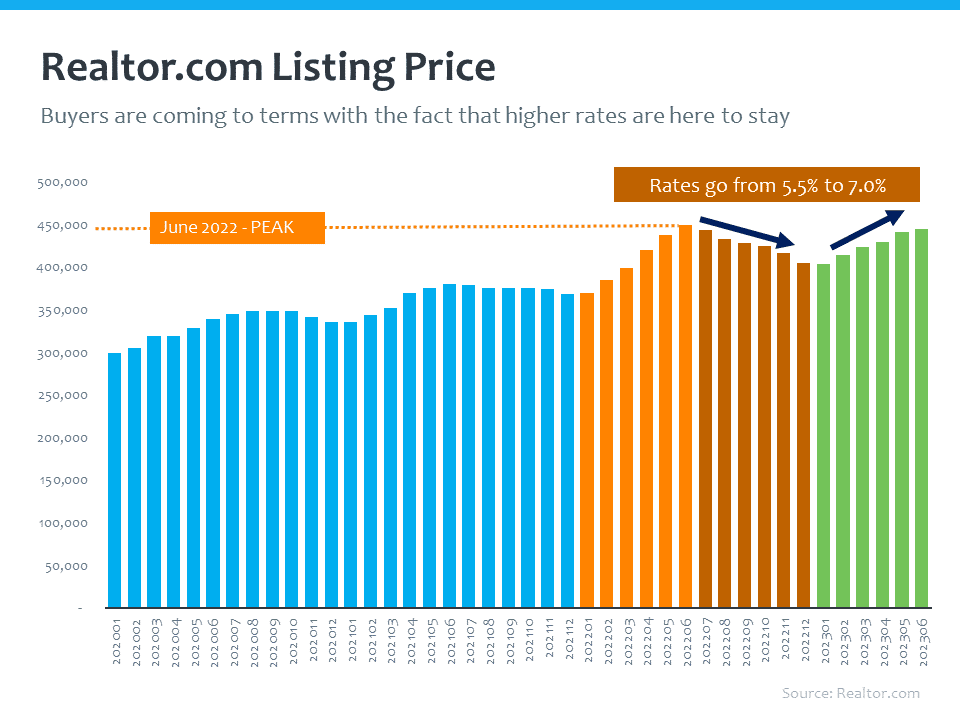
Listing prices are important, because they are the first numbers that buyers see when they come to market. We ramped up in 2022 when prices reach their peak in June. Then, when interest rates went from about 5.5% in June to over 7% in October and November, listing prices naturally retreated signaling a major shift in the market. However, as 2023 turned leaf, what we saw is a lot of buyers come to terms with the fact that higher rates are here to stay, and they returned to the market. In tandem with that return in demand, we saw prices stabilize and then begin an upward push as we move towards the midpoint of the year. Another reminder of the return of the seasonal where prices tend to peak during the summer, and retreat in the fall and winter. With the current median list price only about 0.9% below where it was during last year's record high level, it is another clear indication that market dynamics are shifting towards that normal seasonal pattern.
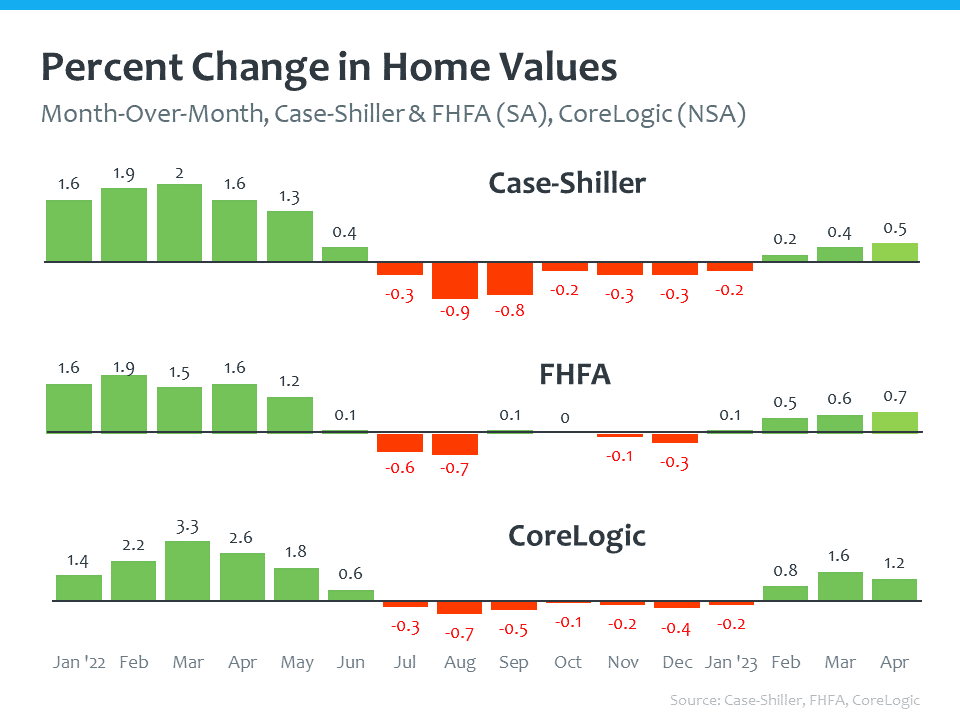
As we discussed last month, and reviewed an example of why median sale price is not a good indicator of home values, we look to the more accurate figure: repeat-sales indices. These track the sale of the same home over time to gauge much more accurately what's happening to home values. The three indices we look to are Case-Shiller, the Federal Housing Finance Agency, and CoreLogic. Month-over-month, in 2022 you see that second half of the year retreat, and then the rebounding momentum in 2023 – indicating prices are on an upward march, as would be typical in a given year.
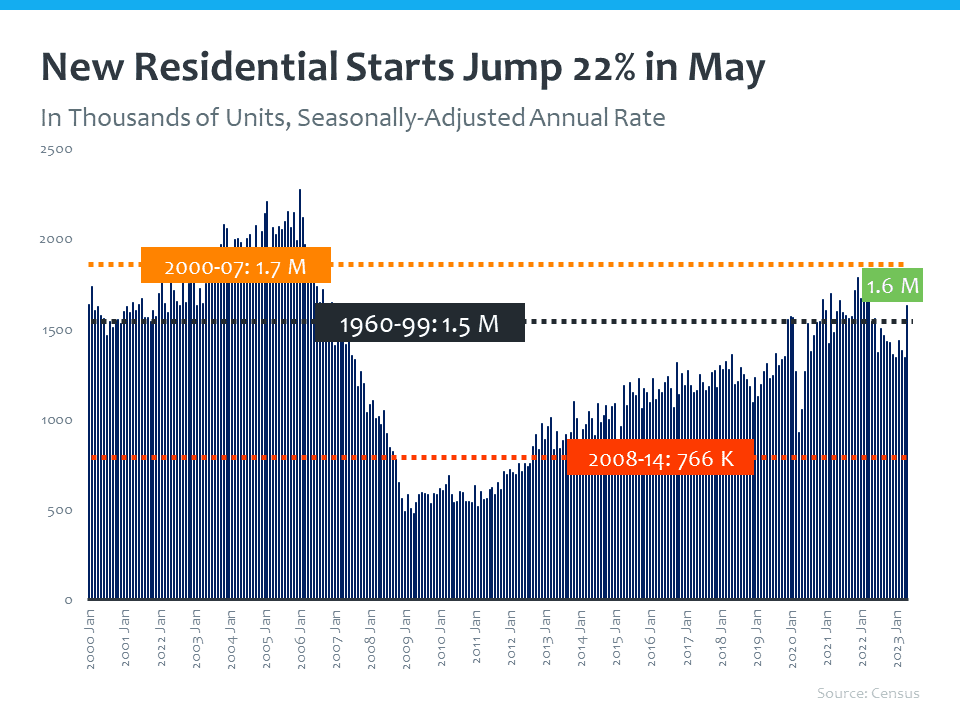
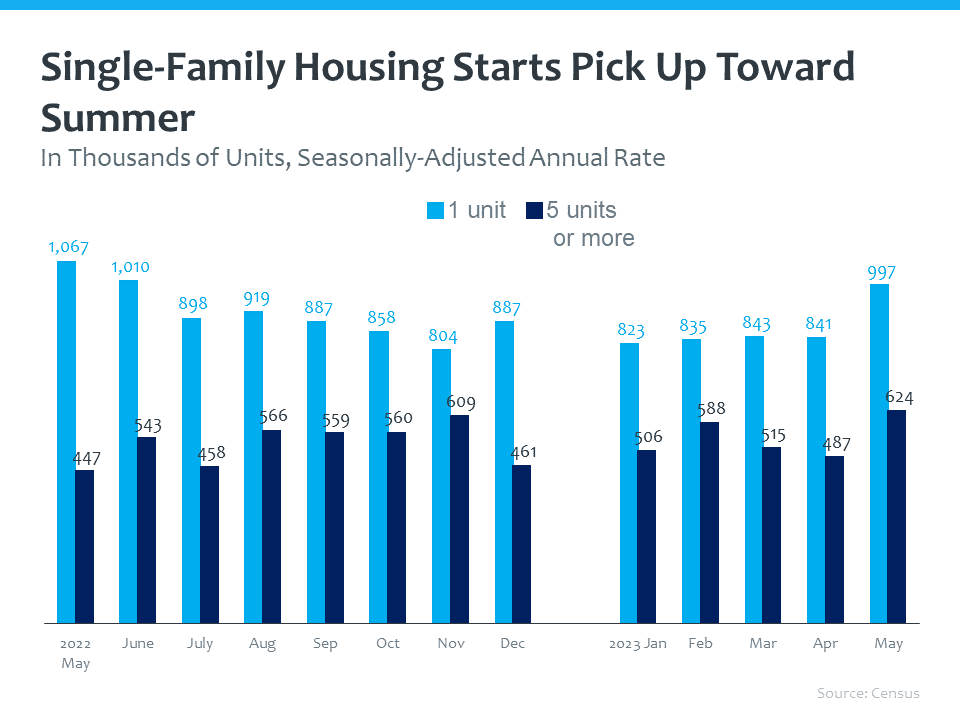
So back to that silver lining, new construction is offering more options in today’s market, and the best way to look at that is residential starts. These are homes that are in the early stages of construction. According to the latest data, we saw a significant jump in residential starts, which can also be a great indication of population growth. Between 2008 and 2014, there was a severe shortage of new construction. Builders recognized that shortage and the demand in the market, and ramped up production.
These residential starts are a solid mix of both single family and multifamily properties.
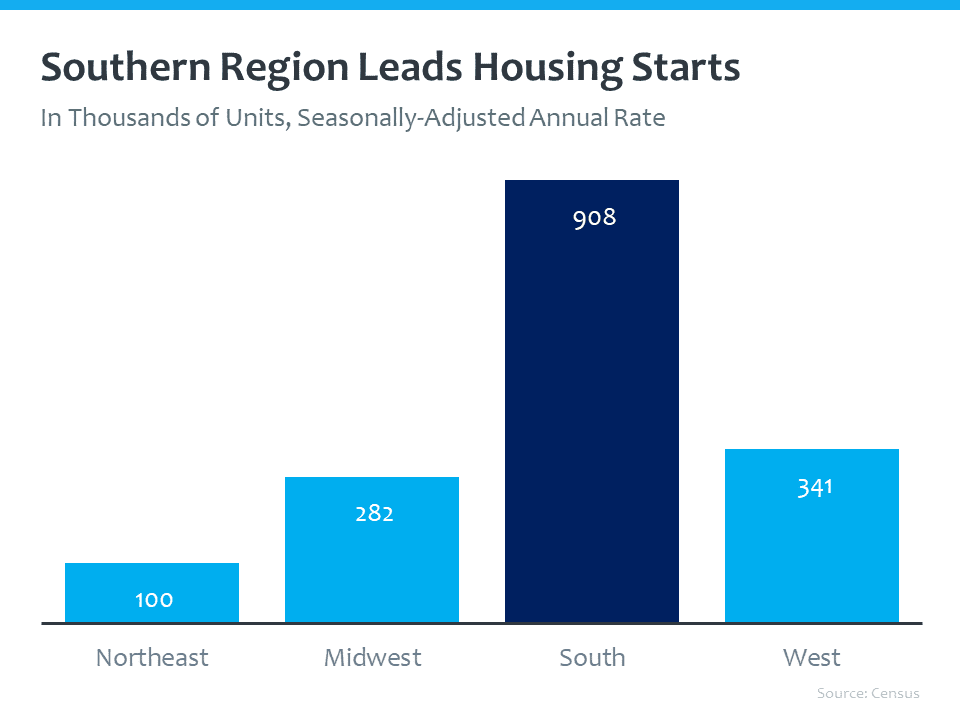
Geographically, the southern region is taking the lead, signifying where the population is growing.
In summary, buyers are active in markets as housing is normalizing, prices are rebounding signifying a return to a healthy market, and new construction is growing, offering more options for buyers and sellers.
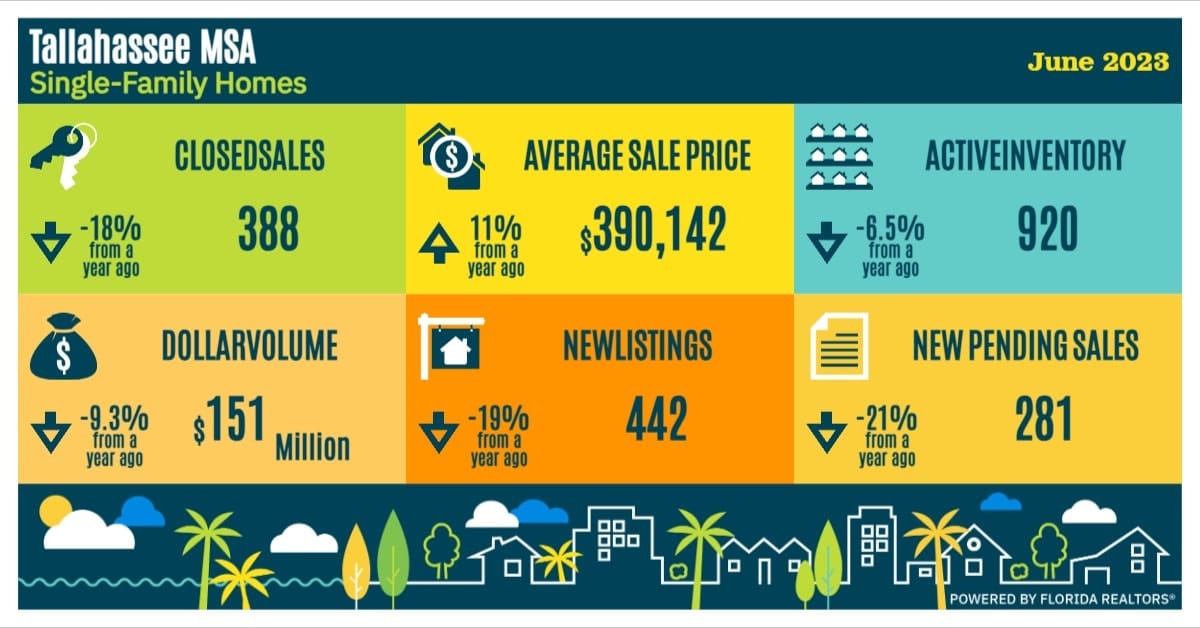
Here's how we wrapped up last month in Tallahassee:
Stay up to date on the latest real estate trends.

All Real Estate News
June 25, 2026

All Real Estate News
June 24, 2026

All Real Estate News
June 23, 2026

All Real Estate News
June 22, 2026

All Real Estate News
June 18, 2026

All Real Estate News
June 17, 2026
You’ve got questions and we can’t wait to answer them.