July 2025 Real Estate Market Update
July 16, 2025
All Real Estate News

July 16, 2025
All Real Estate News
 |
June 2024 Real Estate Market Update Written By: Ivan Marquez Executive Assistant, Hum Real Estate |
This month, we’re breaking down new construction trends, builder incentives, falling prices in some metros, and what experts predict for 2025 home values.
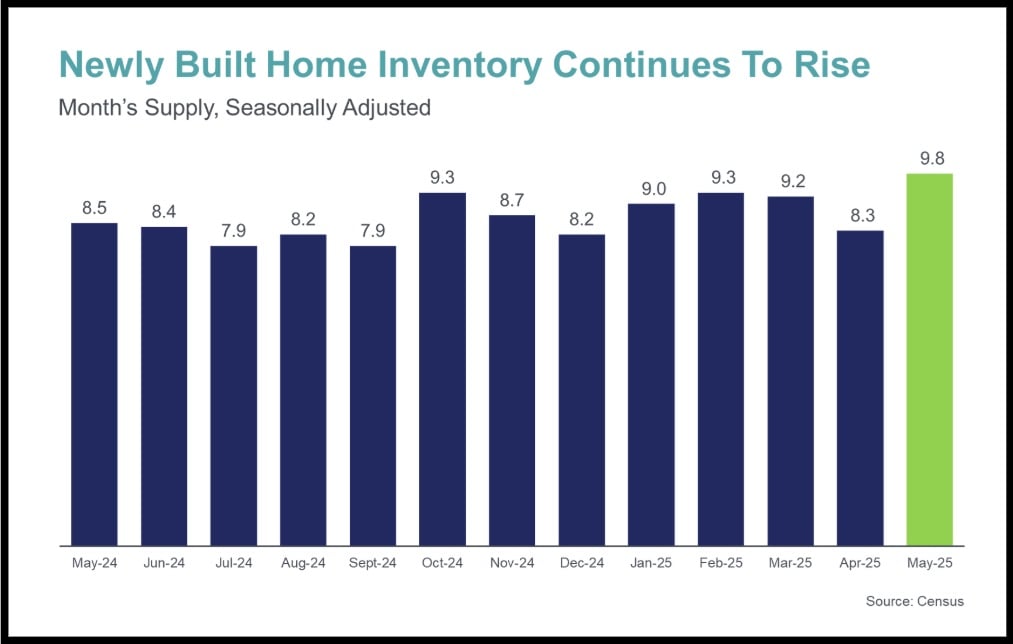
Even if you're not directly working with builders, it's important to know what options are out there, especially for buyers exploring the market right now. One key trend to watch: the newly built home inventory is growing.
Right now, the supply of new construction homes has reached 9.8 months nationwide, which is higher than we’ve seen in the past year. That means there are more new homes available, giving buyers more choices.
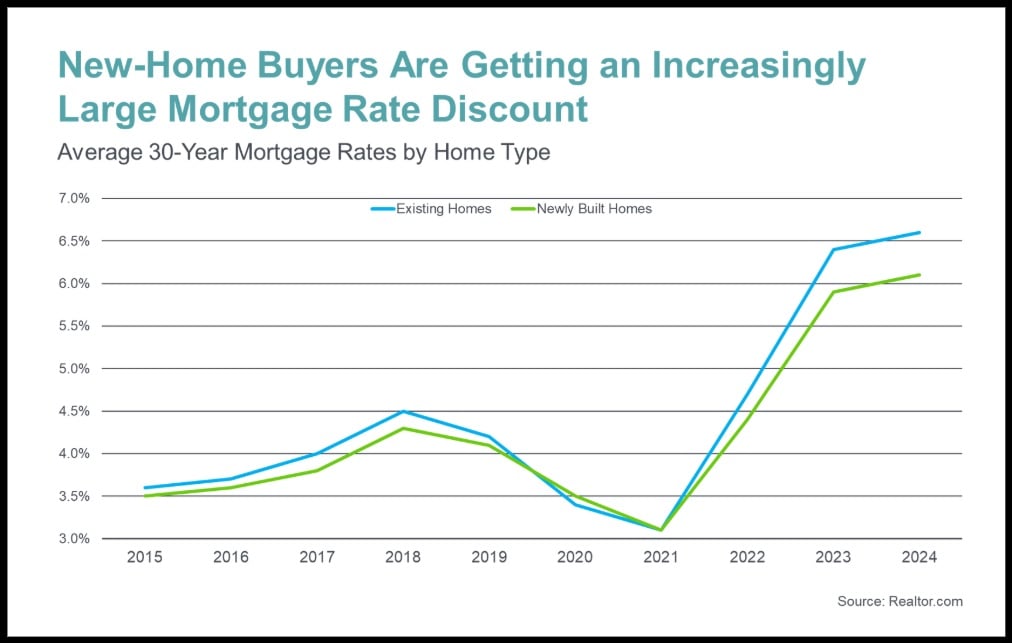
Builders are helping buyers by offering lower mortgage rates. On average, rates for new homes are about 0.5% lower than for existing homes because builders are using incentives to buy down rates. It’s a smart option for budget-conscious buyers.
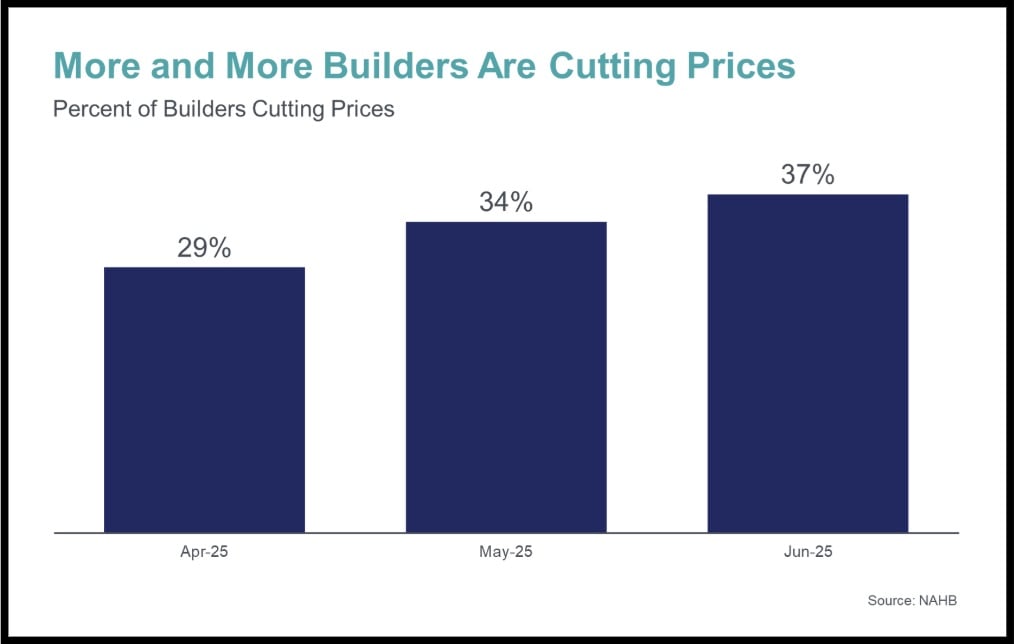
According to the National Association of Home Builders, 37% of builders are now cutting home prices. With more inventory on the market, many are also offering mortgage incentives to attract buyers and get homes sold.
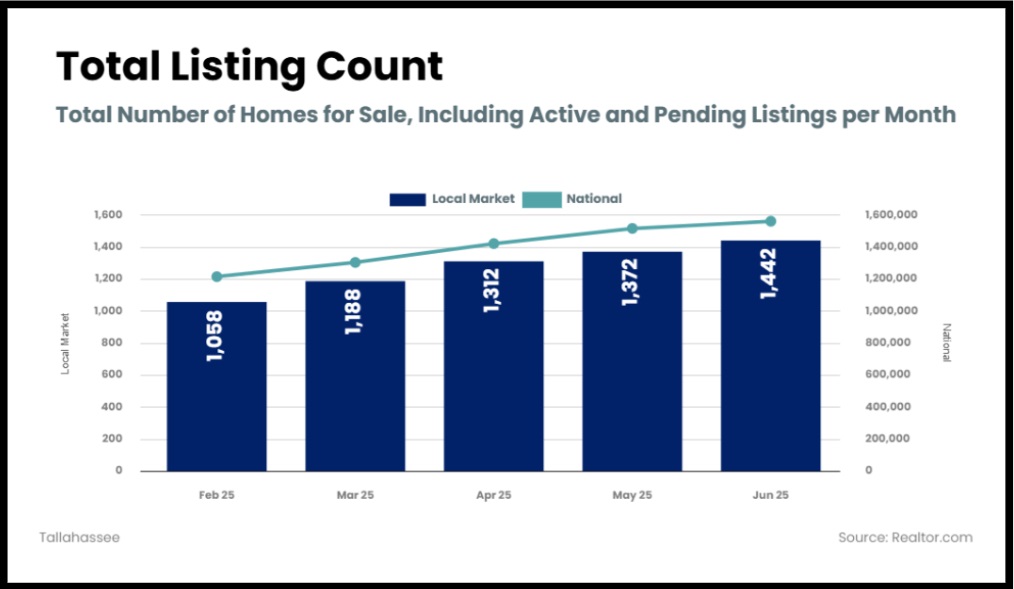
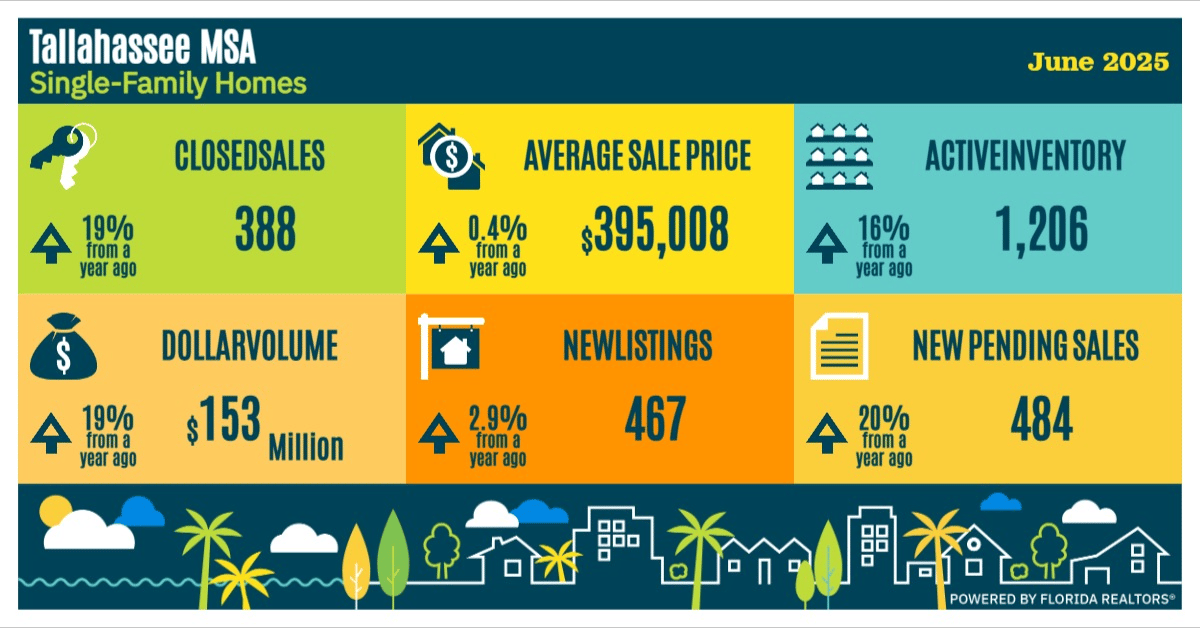
Locally, there has been a steady rise in Tallahassee’s total housing inventory, increasing from 1,058 listings in February to 1,442 in June. The national trend shows a similar climb. As more homes hit the market, buyers may benefit from expanded choices and improved negotiating power.
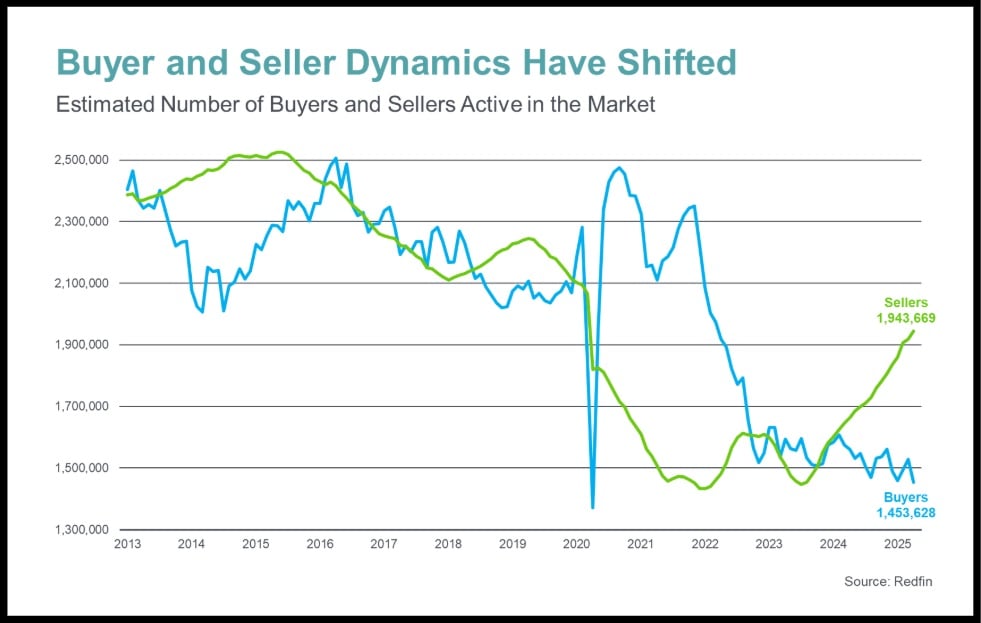
Redfin data shows there are more sellers than active buyers right now. But don’t be fooled, demand is still strong. Many people want to buy a home but are held back by affordability challenges, not a lack of interest.
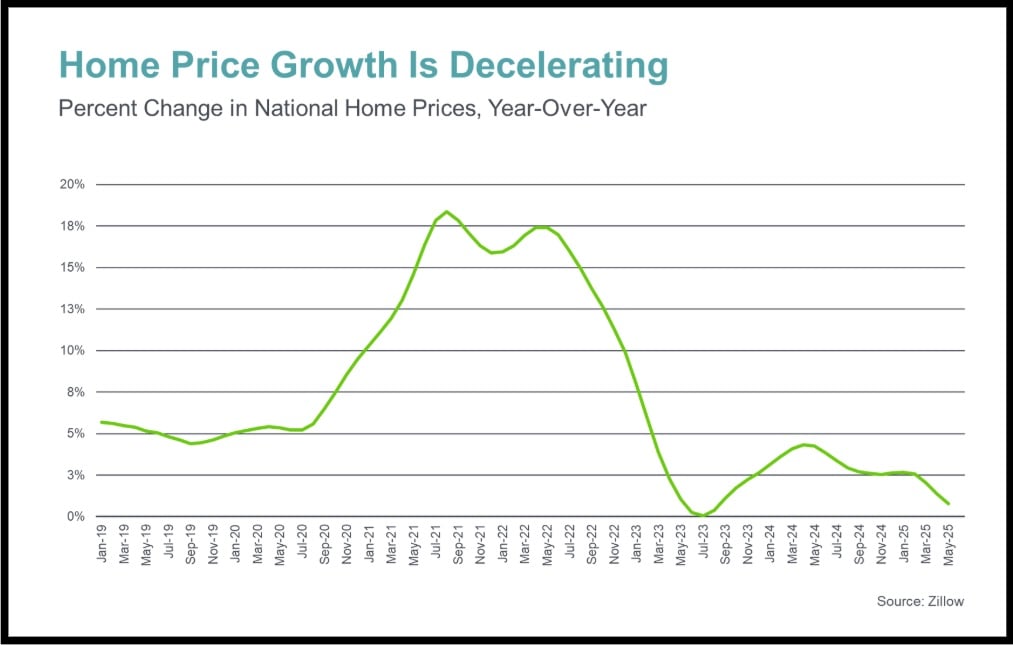
After the rapid price growth in 2020 and 2021, home price appreciation has slowed down significantly. Some markets are even seeing price declines, marking a shift from the peak pandemic years.
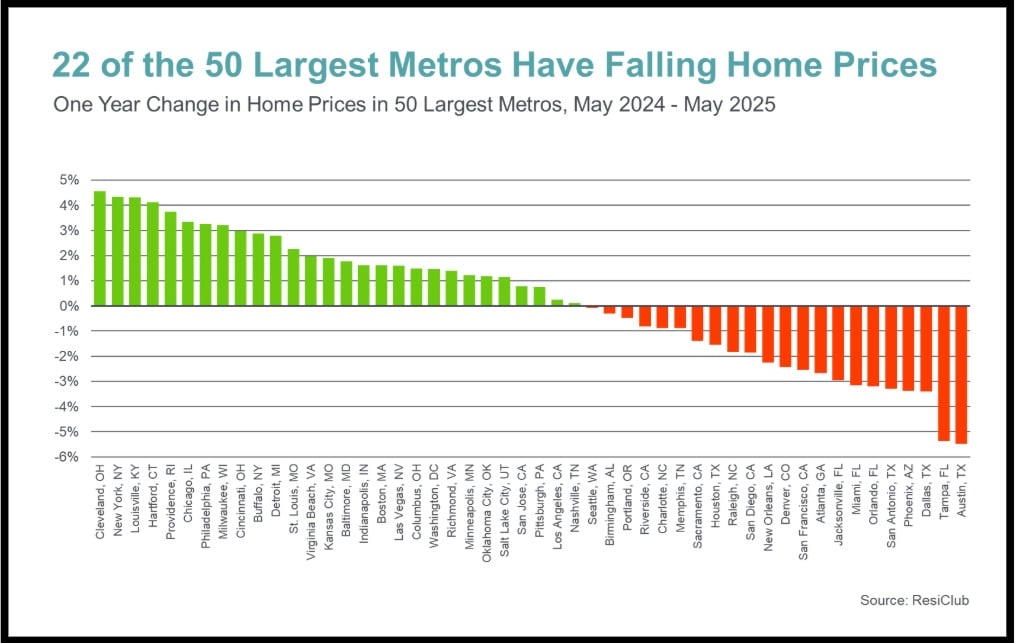
So, where are home prices falling? In 22 of the largest U.S. metros, Tampa and Austin saw around a 5% year-over-year decline (May 2024 to May 2025). However, these areas had huge gains over the past five years, so they’re still ahead overall. Most declines are around 2–3%, while some markets are still showing slight growth.
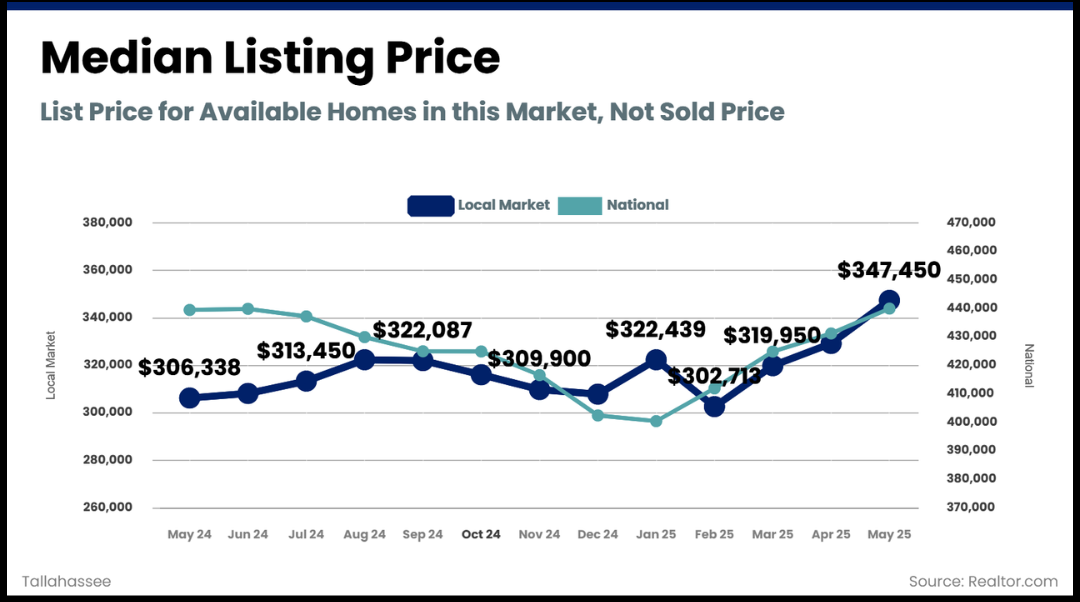
And, where does Tallahassee stand on home prices? Recently, trending along with the national average, seeing steady growth.
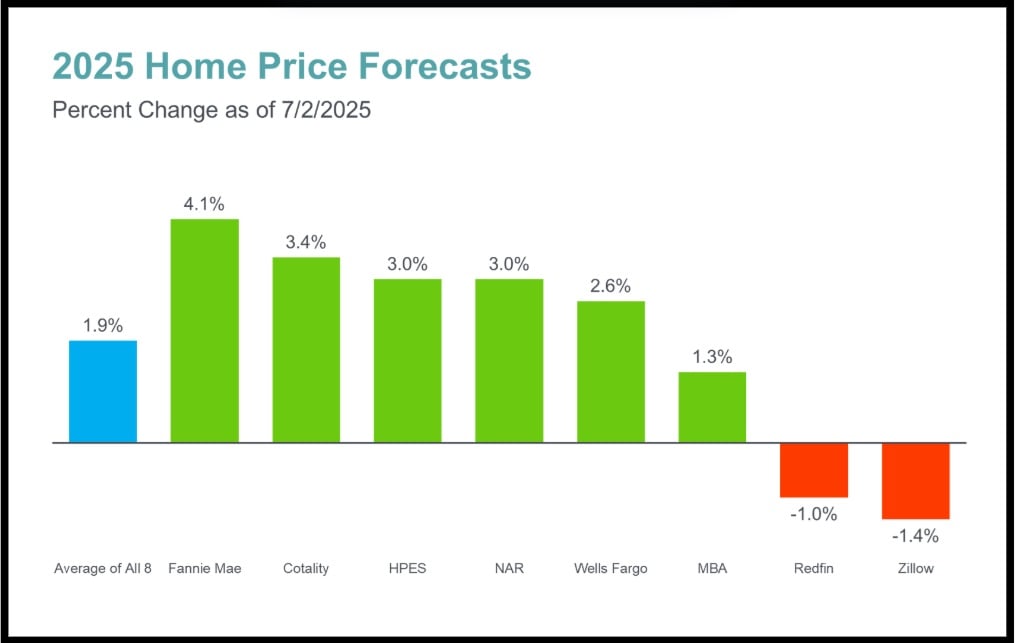
As of early July, eight major forecasters expect home prices to rise by an average of 1.9% in 2025. While Redfin and Zillow predict slight declines, most expect modest gains of 2–3%. Still, outcomes will vary depending on the local market.
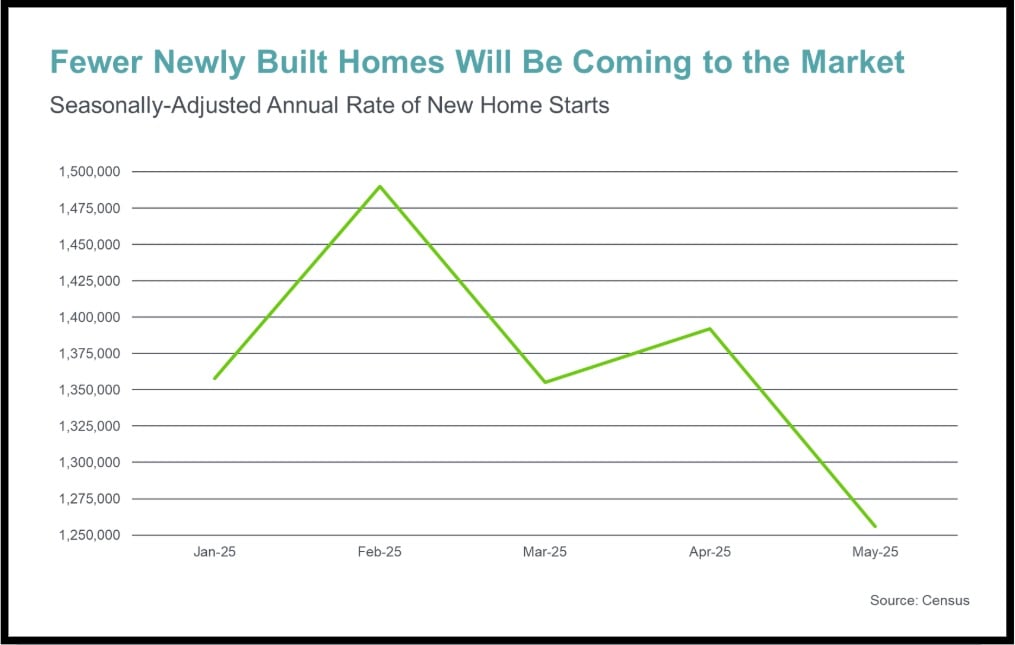
Realtor.com reports that homebuilders expect a decline in single-family home construction in 2025. With economic uncertainty, fewer new homes are being started, especially from January to May this year, as builders take a cautious approach.
Buyers have more options as new construction rises and builders offer incentives. Overall demand remains strong, and 2025 is expected to bring modest price growth.
Stay up to date on the latest real estate trends.

All Real Estate News
November 10, 2026

All Real Estate News
November 10, 2026

Local Events
November 7, 2026

Local Events
November 6, 2026
All Real Estate News
November 4, 2026

All Real Estate News
November 3, 2026
You’ve got questions and we can’t wait to answer them.