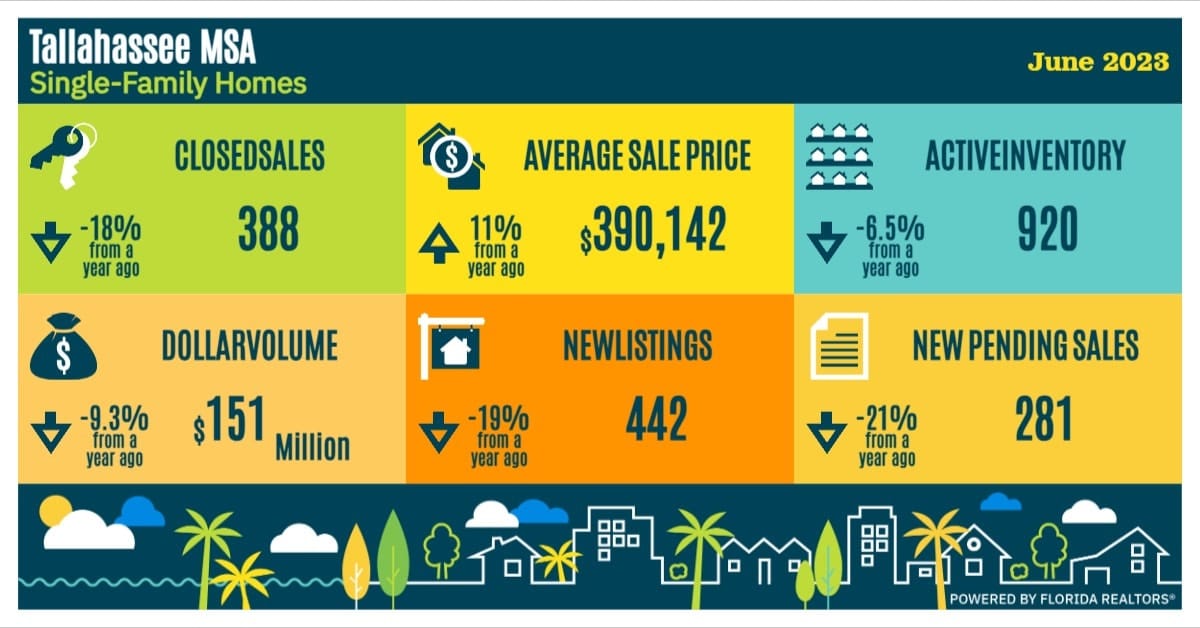
June 2023 Real Estate Market Update
June 29, 2023
All Real Estate News

June 29, 2023
All Real Estate News
Probably the most confusing thing to all of us right now is the mortgage rate. For over 50 years, the average spread (or difference) between the 10-year treasury yield and the 30-year fixed mortgage rate was 1.72%. The two seemed to move in unison with each other since the 1970s. Essentially, if you added 1.72% to the 10-year treasury yield, you would arrive at the 30-year mortgage rate.
However, at the beginning of this year, that spread increased. For the first 5 months of this year, the average spread between the 10-year treasury yield and the 30-year fixed mortgage rate was 2.96%.
Although an extremely rare occurrence, historically, a spread above 3% has been the case during times of economic volatility or high inflation.
The next important factor is home price appreciation – not median home price. Median home price, or median sales price, measures the middle price of sold homes. In other words, half sold for less, and half sold for more, but that does not mean a home is worth less. It means there are more lower priced homes being sold, which is just the market we are in. Here’s an easy example of that:
You have one nickel and two dimes. Lined up in ascending value (lowest to highest), the median value is 10 cents. If you have two nickels and one dime, the median value is now 5 cents, but the value of each coin did not change. Median home values do not reflect the value of homes.
So, what is really happening with prices? Repeat sales indexes are accurate in determining home prices, but this data also lags in its reporting. Here is how home values are trending among the most reputable home price indexes: Case-Shiller, the Federal Housing and Finance Administration, and CoreLogic. All three suggest prices are stabilizing.
Here's how we closed out the month in Tallahassee:
Stay up to date on the latest real estate trends.

All Real Estate News
November 10, 2026

All Real Estate News
November 10, 2026

Local Events
November 7, 2026

Local Events
November 6, 2026

All Real Estate News
November 4, 2026

All Real Estate News
November 3, 2026
You’ve got questions and we can’t wait to answer them.