March 2023 Real Estate Market Update
March 19, 2023
All Real Estate News

March 19, 2023
All Real Estate News
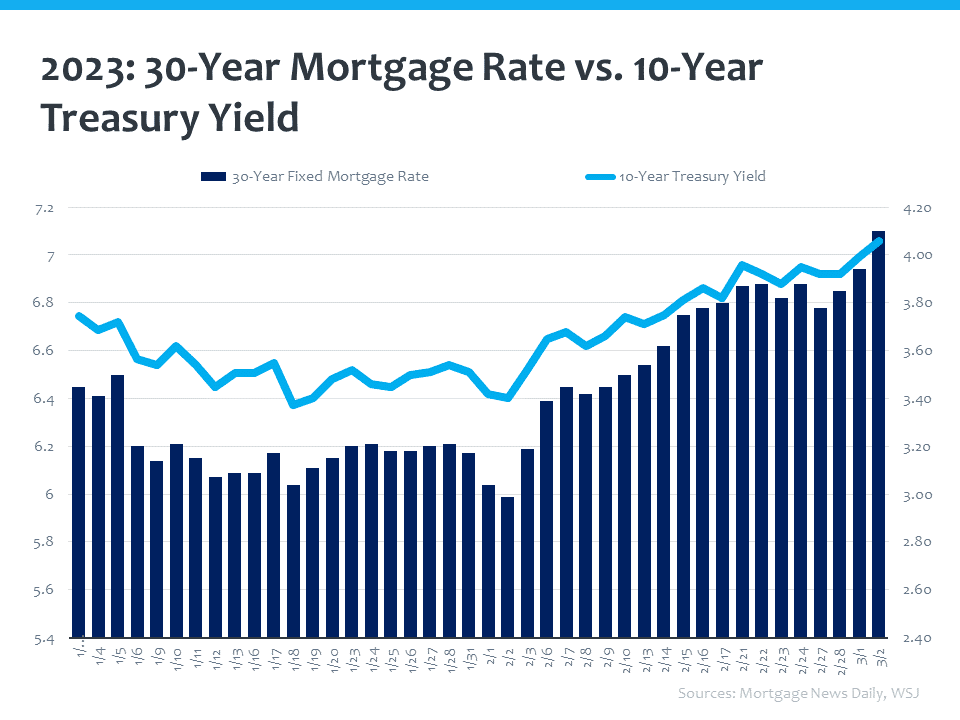
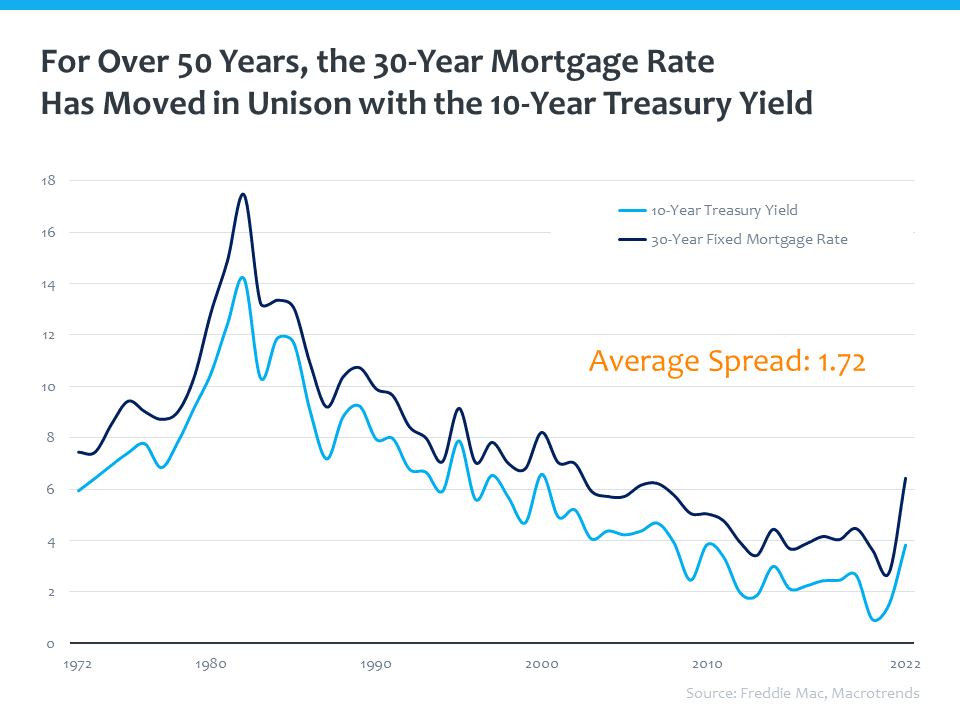
Interest rates are still volatile right now, so it is important to understand what influences the 30-year mortgage rate. It is the 10-year treasury yield.
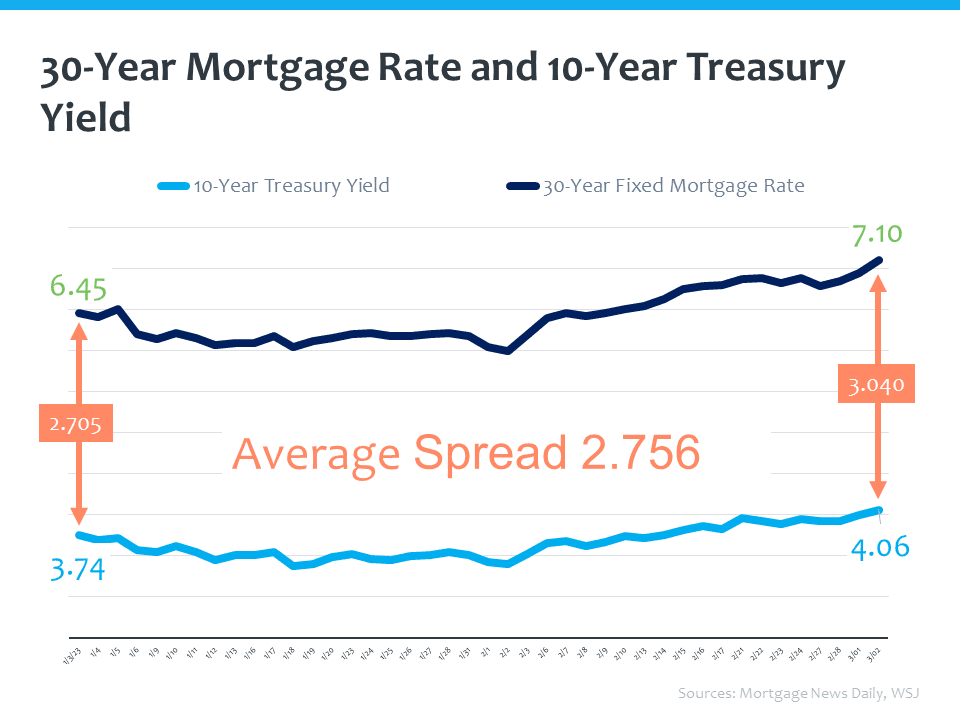
Over the last 50 years, the 30-year fixed mortgage rate has moved in unison with the 10-year treasury yield. They have a sort of symbiotic relationship, where the average spread (difference between the two) is 1.7%. In other words, historically if you take the 10-year treasury yield and add 1.7%, you would arrive around where the 30-year fixed mortgage rate is.
However, the spread between the 10-year treasury yield and the 30-year fixed mortgage rate has widened. This widening tends to be a measure of fear and volatility in the market. This makes adjustable-rate mortgages and buy downs more important than ever.
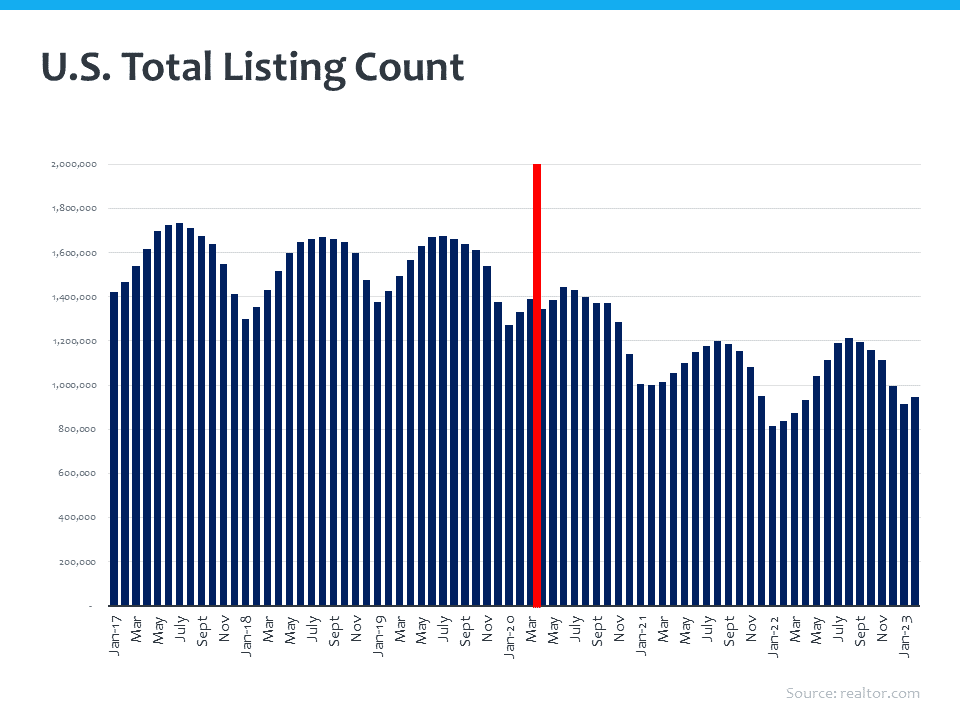
While interest rates are a major concern, inventory is an even bigger challenge. 2017, 2018, and 2019 were fairly normal years - following the typical cyclical nature of the real estate business. However, during the spring of 2020, inventory started to fall. COVID caused uncertainty. The meaning of home changed. Interest rates sank to 2.75%. Inventory was depleted.
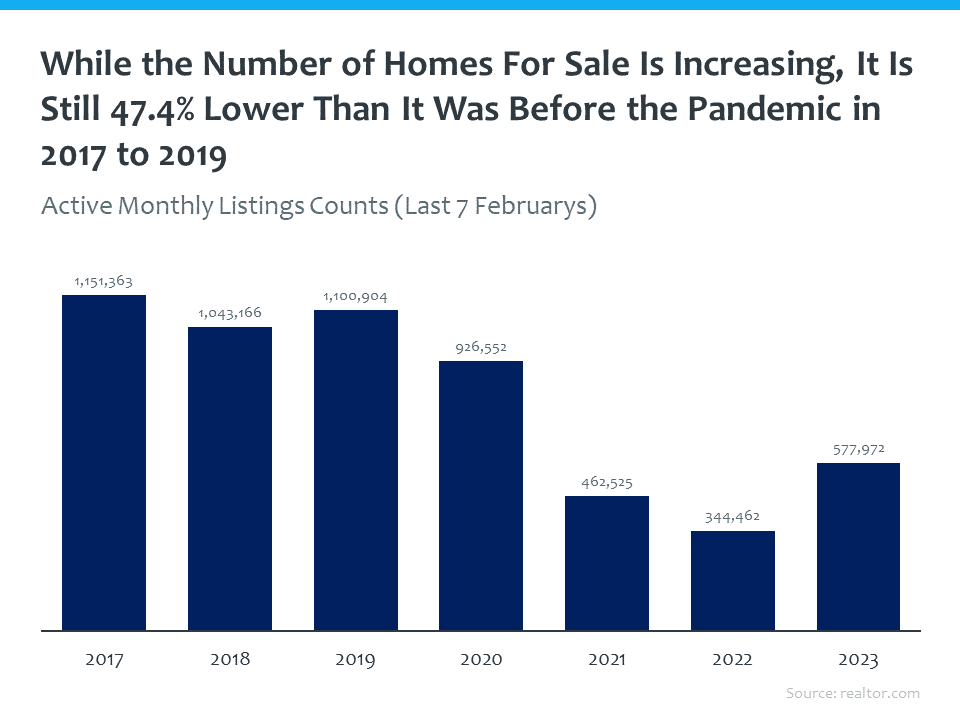
And, while inventory, has risen, it is still far below where it was prior to the pandemic. According to realtor.com, here are the active monthly listings in the last seven Februarys. Understand that today’s numbers need to be compared to pre-pandemic numbers, because of the volatility of the market the past few years. There is significantly less inventory across the country, and we need more.
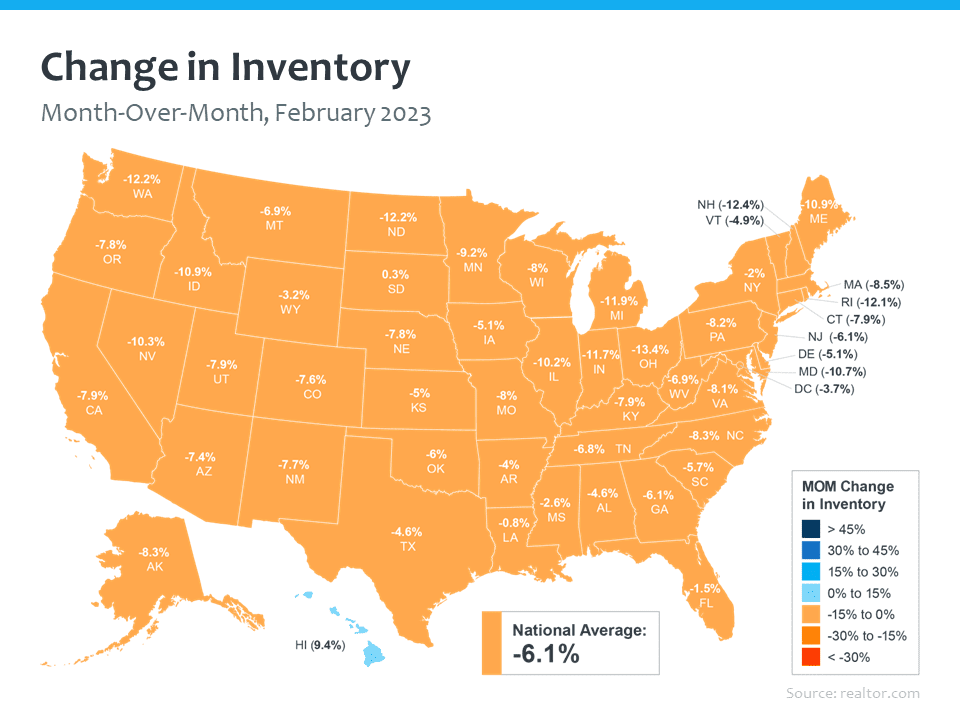
Month-over-month, we've depleted even more inventory. Inventory was down about 6% from January to February.
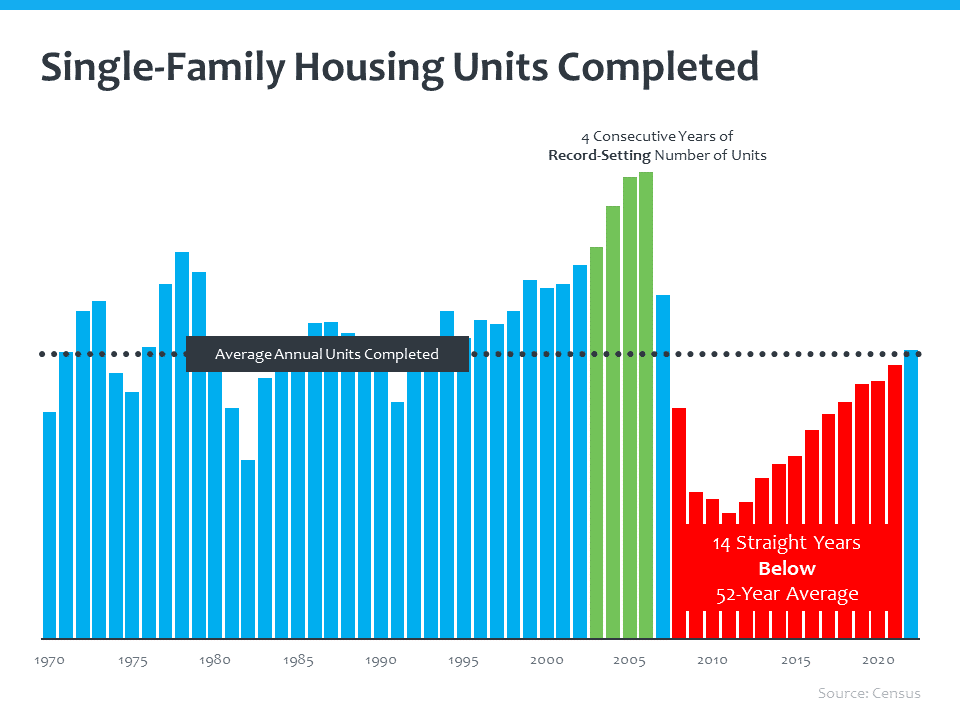
The lack of inventory in this country has kept upward pressure on prices. Looking at single family housing units that have been completed, going all the way back to the 70s, we can see that for 14 straight years we've been below the 50-year average in the number of units brought to market. And that has contributed to the current deficit. In combination with the pandemic’s low interest rates, prices rose.
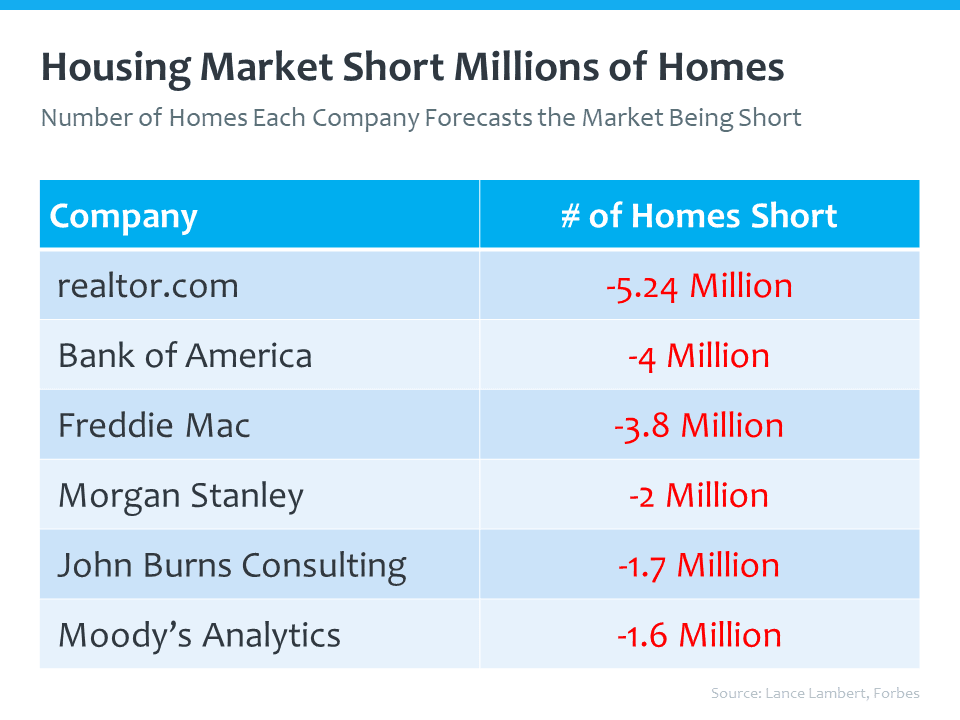
The commonality among the experts is that there aren't enough homes on the market for the number of people that want to buy them.
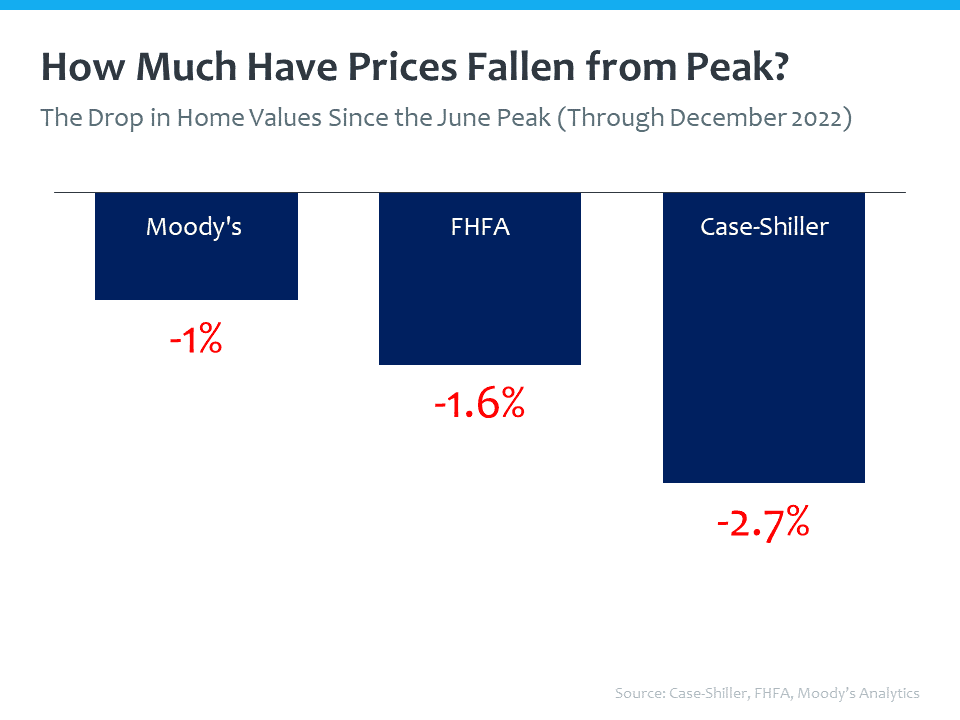
Home prices peaked in June of last year, and the most recent information we have at this point is through December 2022, because this information runs in arrears. We are not seeing predictions of a runaway train of 20% depreciation.
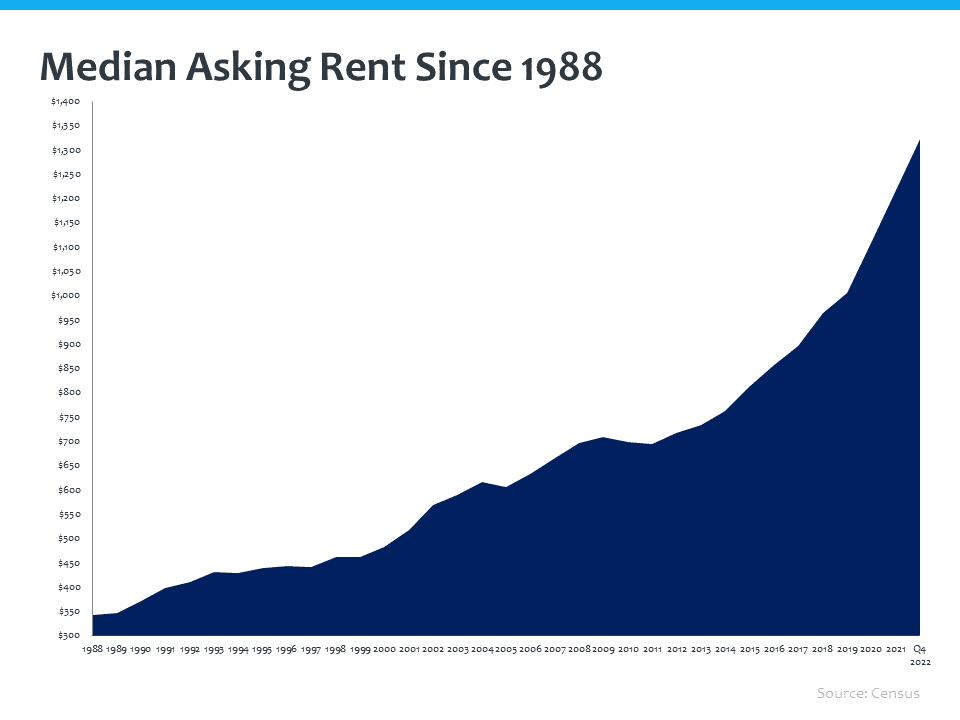
If now is the right time to buy is always specific to your situation, but it is important to keep in mind a few things. First of all, rent always goes up, and dramatically in the past few years. When you buy a home, your mortgage payment remains fixed, bringing stability to the largest expense of most household budgets.
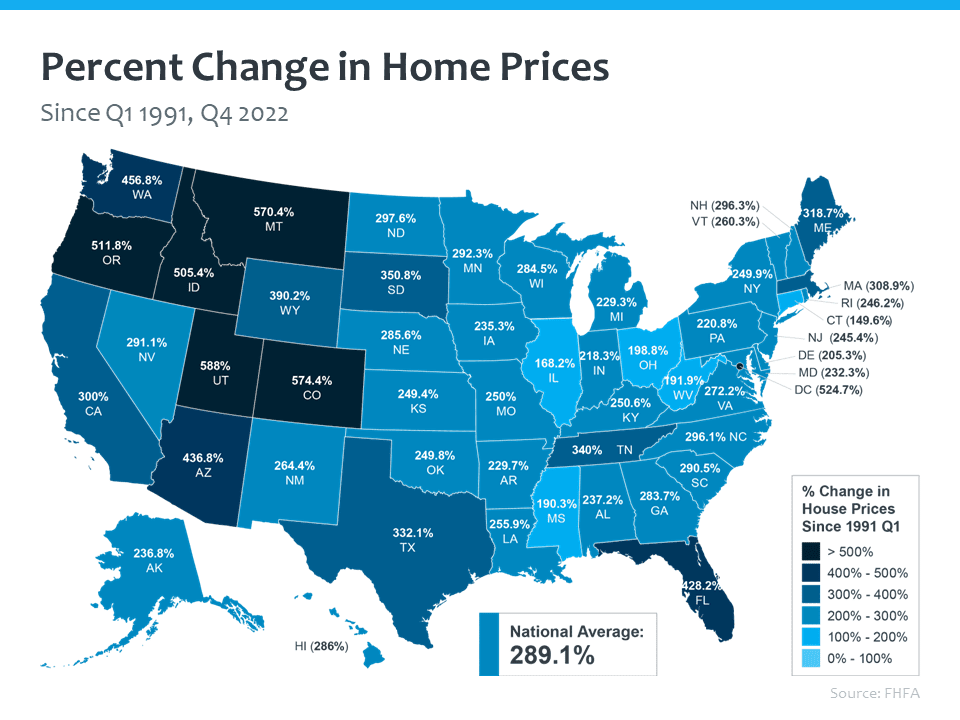
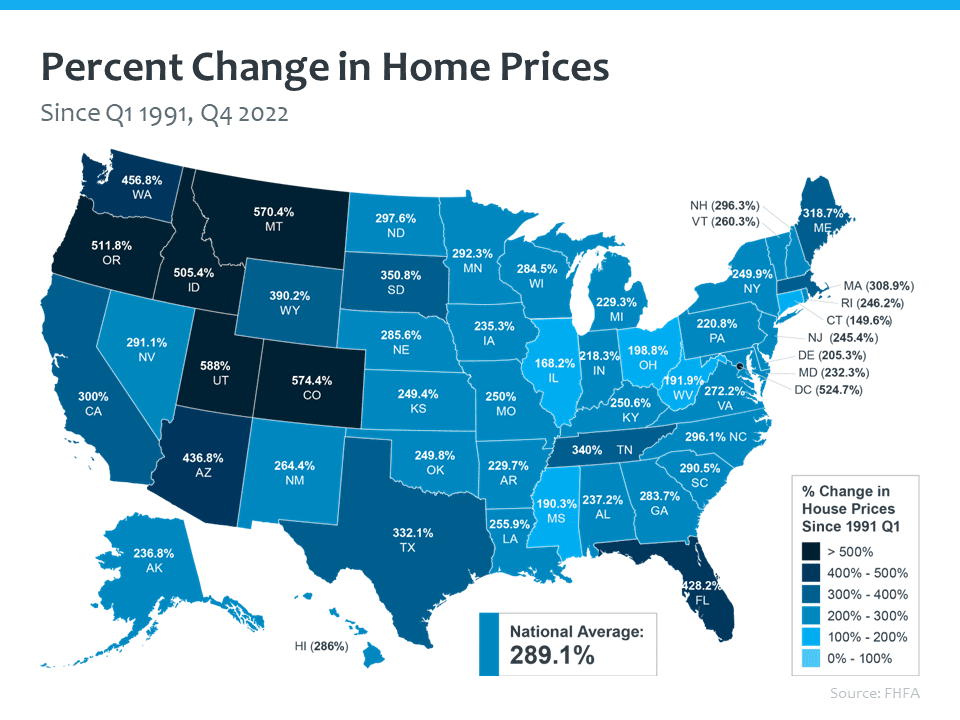
Second thing, prices go up. Since 1991, we see a national home price increase of 289%, and a whopping 428% in Florida.
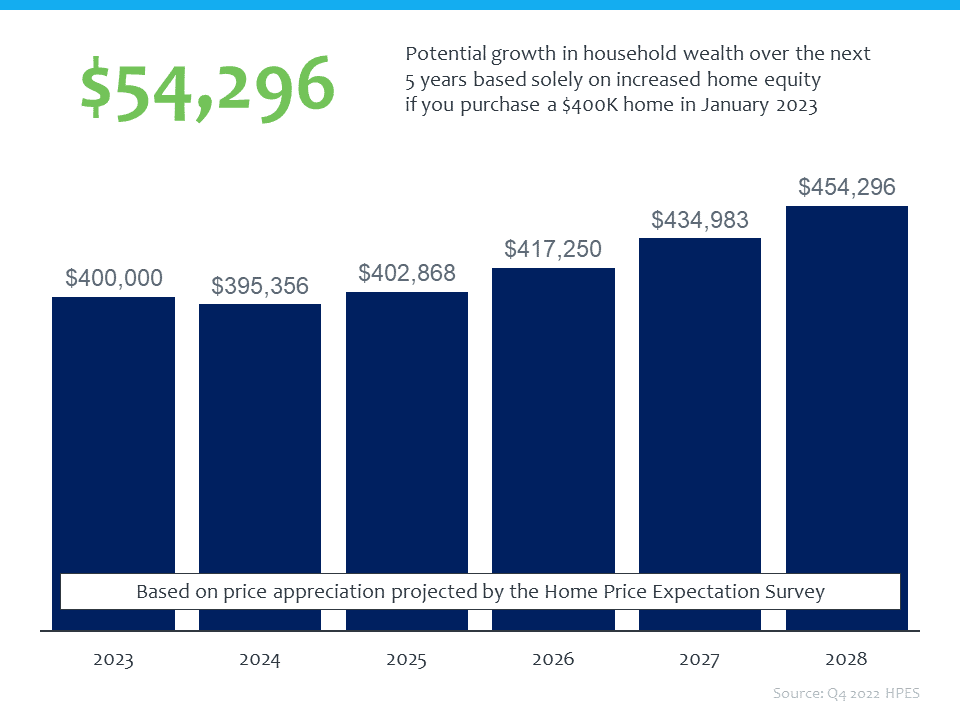
This is the home price expectation survey, which shows projected appreciation through 2028 – an enormous opportunity to gain equity. This brings us to our third and final thought about if now is the right time to buy: Owning a home is an equity builder. A $400,000 home purchased this year, could be worth $454,296 by 2028 – an equity gain of $54,296.
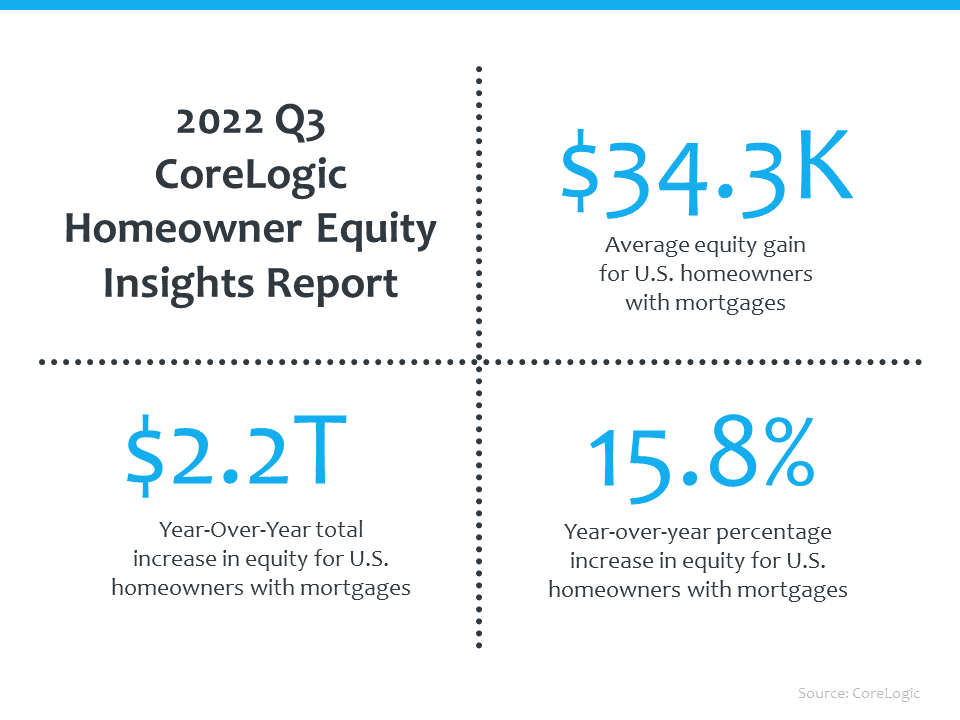
According to the 2022 third quarter CoreLogic Homeowner Equity Insight Report, homeowners gained on average over $34,000 in equity in one year! That is a 15.8% increase year-over-year.
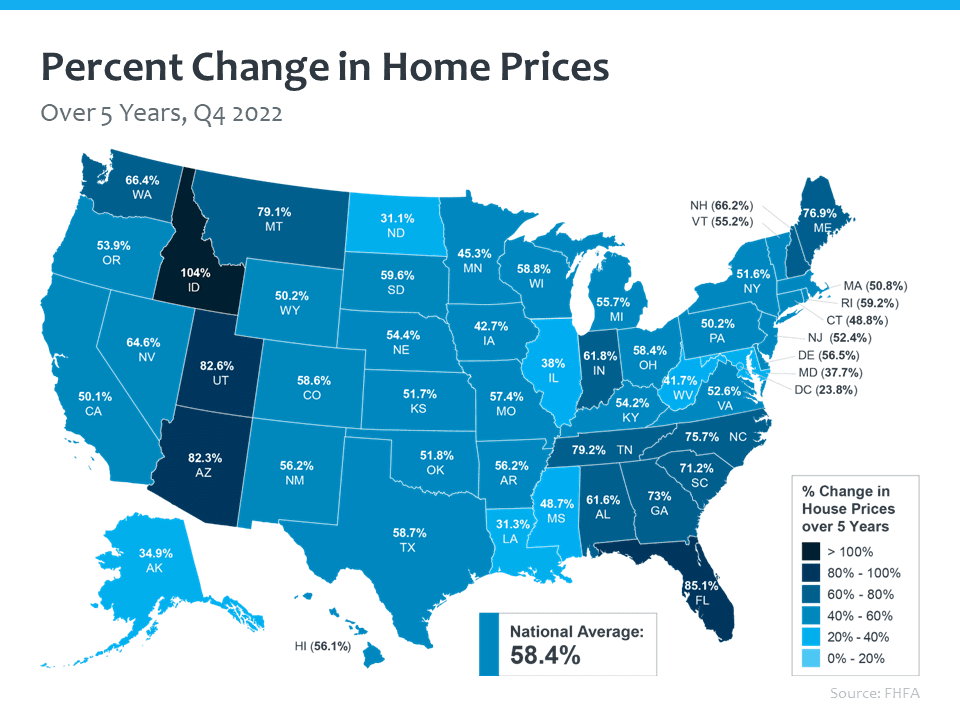
On a more granular level, you can see how this varies by market. The percent change in home prices over the past five years is 58.4%, nationally, and 85.1% in Florida. Homeowners likely have more equity than they realize, and you can get a detailed report on your home’s value at HomeSweetHomeBot.com.
Here’s how that lays out over the past 30-years. A 289% average equity gain for the US homeowner! There are highs and lows in home values, but home ownership really grows over time.
For a more detailed look at what the spring market holds, check out our Selling Your Home Guide and Buying a Home Guide – both updated quarterly with today’s market information.
Stay up to date on the latest real estate trends.

All Real Estate News
October 23, 2026

All Real Estate News
October 23, 2026

All Real Estate News
October 21, 2026

All Real Estate News
October 20, 2026

Articles for Buyers
October 19, 2026

October 19, 2026
You’ve got questions and we can’t wait to answer them.