November 2023 Real Estate Market Update
November 30, 2023
All Real Estate News

November 30, 2023
All Real Estate News
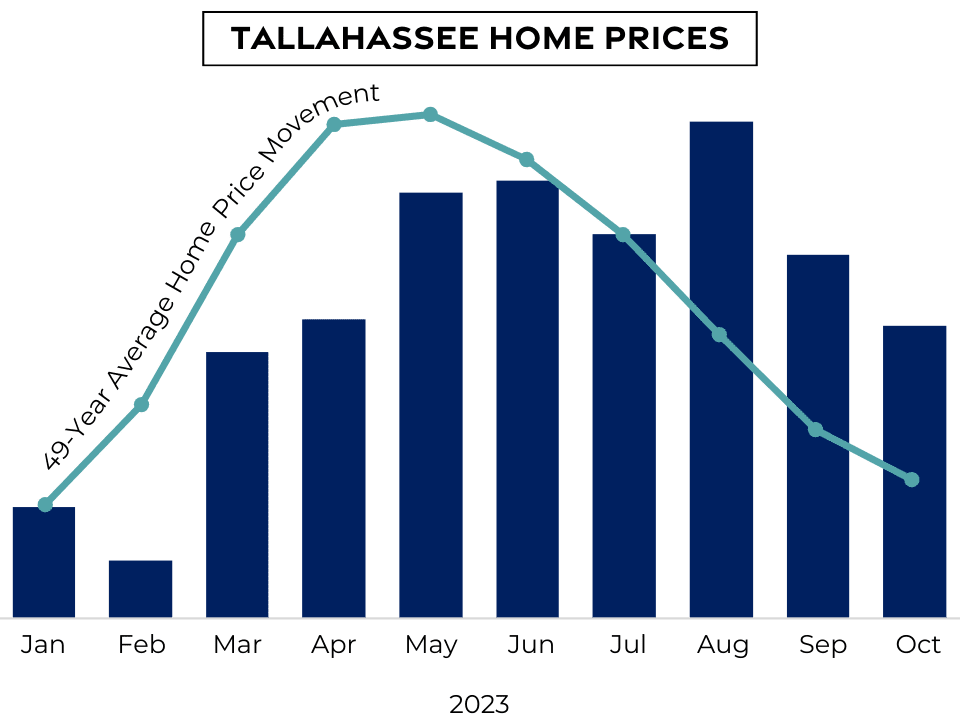
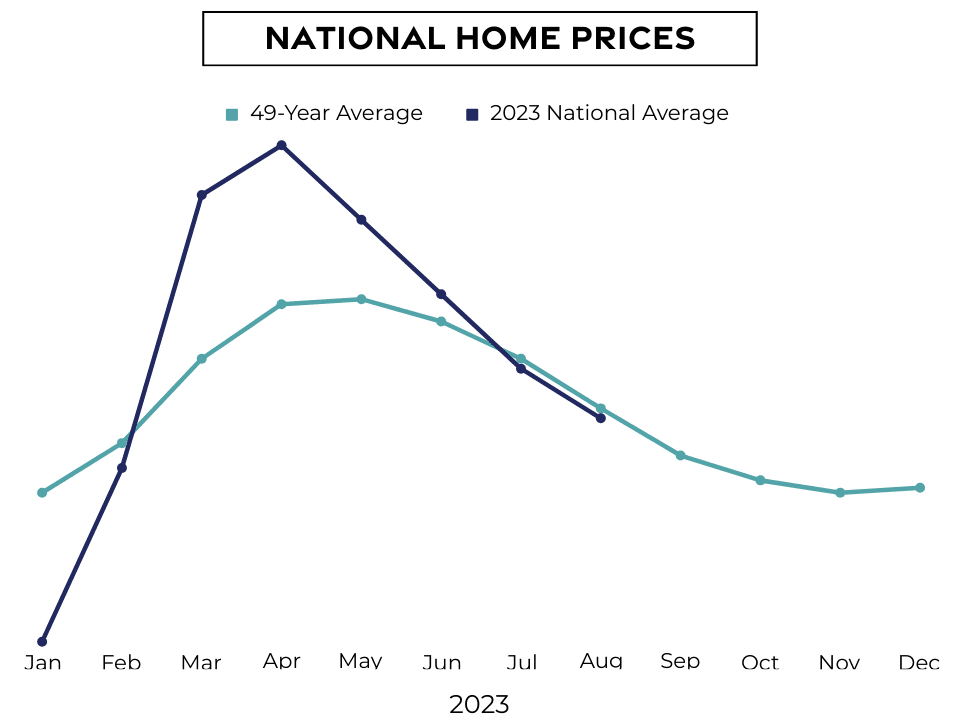
Usually this is a time of year where the level of appreciation starts slowing down (deceleration – not depreciation).
When we try to overlay the 49-year average seasonal home price movement over this year’s sales in Tallahassee, we see that home prices locally may not be decelerating as quickly as they have historically.
However, nationally the level of appreciation is starting to moderate back to more normal levels.
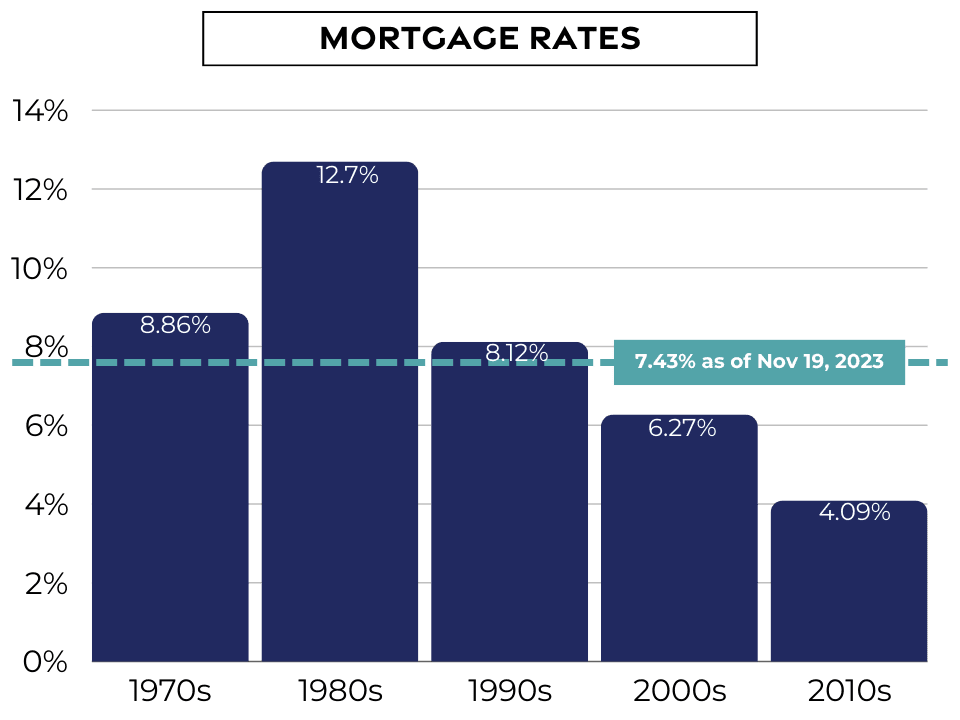
The current mortgage rates are impacting affordability, where the average monthly payment has increased $200 since May. However, since home value appreciation is returning to more normal levels, and equity gains appear to be outweighing the cost of the higher mortgage rates, people are still planning to buy a home.
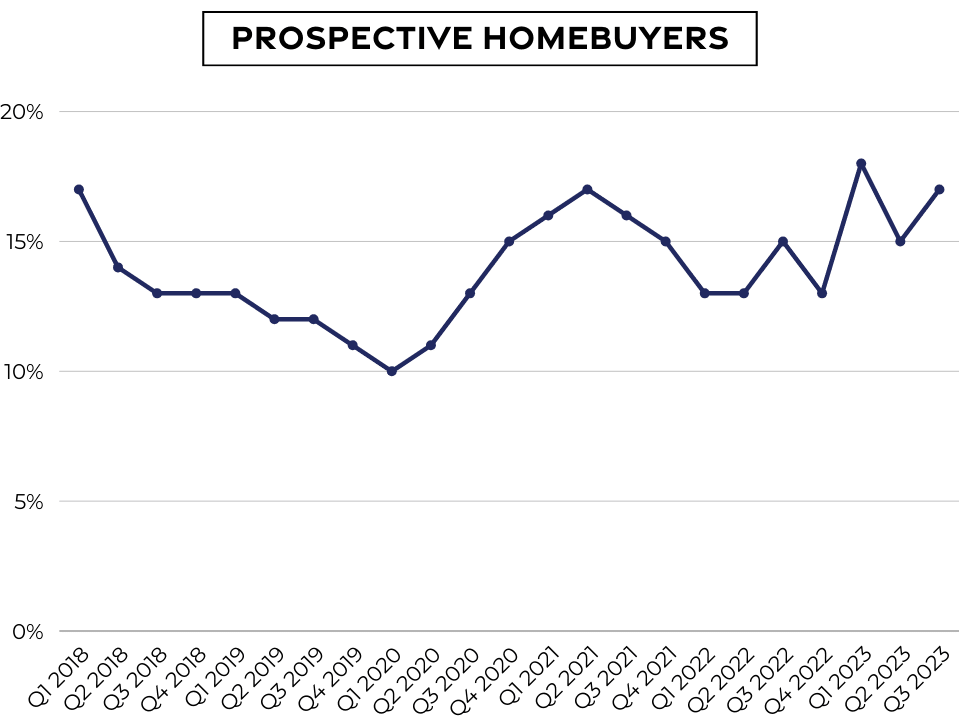
According to the National Association of Home Builders Housing Trends Report, 17% of prospective homebuyers plan to purchase a home in the next 12 months.
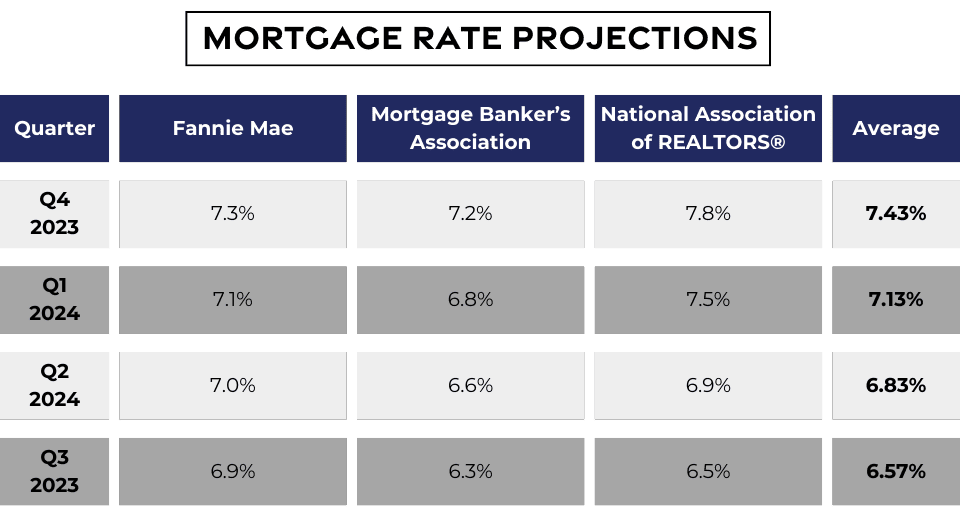
And buying now might be a smart move. Interest rates are predicted to not quite drop a whole percentage point by this time next year.
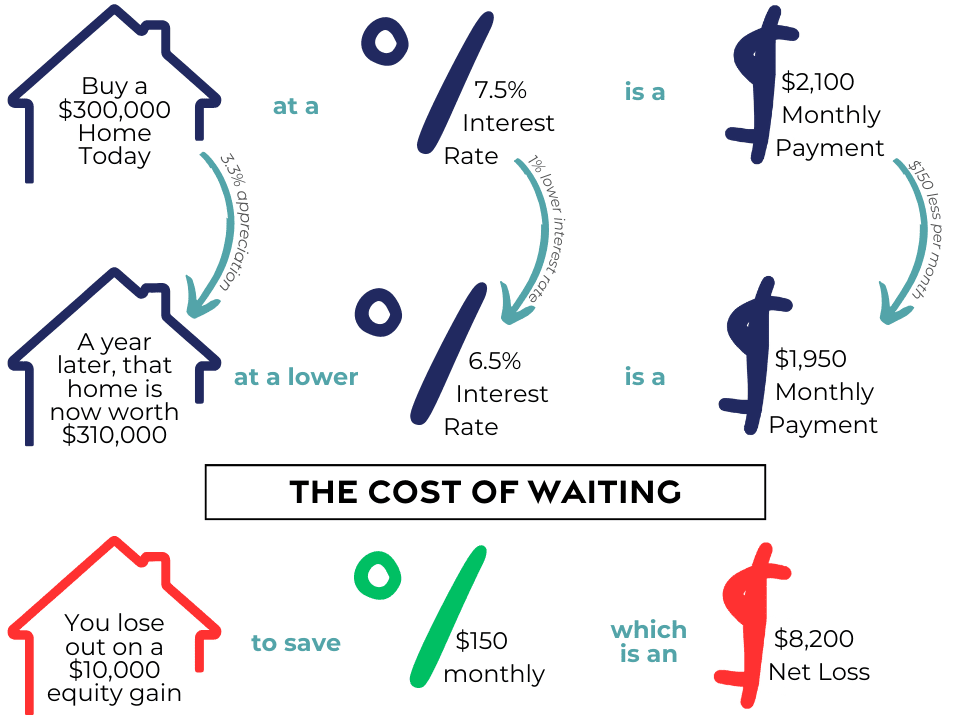
And by this time next year homes are likely to have appreciated in value between 3% and 5%. For an average-priced home, that could mean you wait a year to save $150 a month on your mortgage payment, but lose out on the opportunity to gain $10,000 in equity.
And if you are renting that average-priced home, you’re likely looking at a $2,500 monthly payment. That equates to $30,000 a year in that could be invested in an appreciating asset.
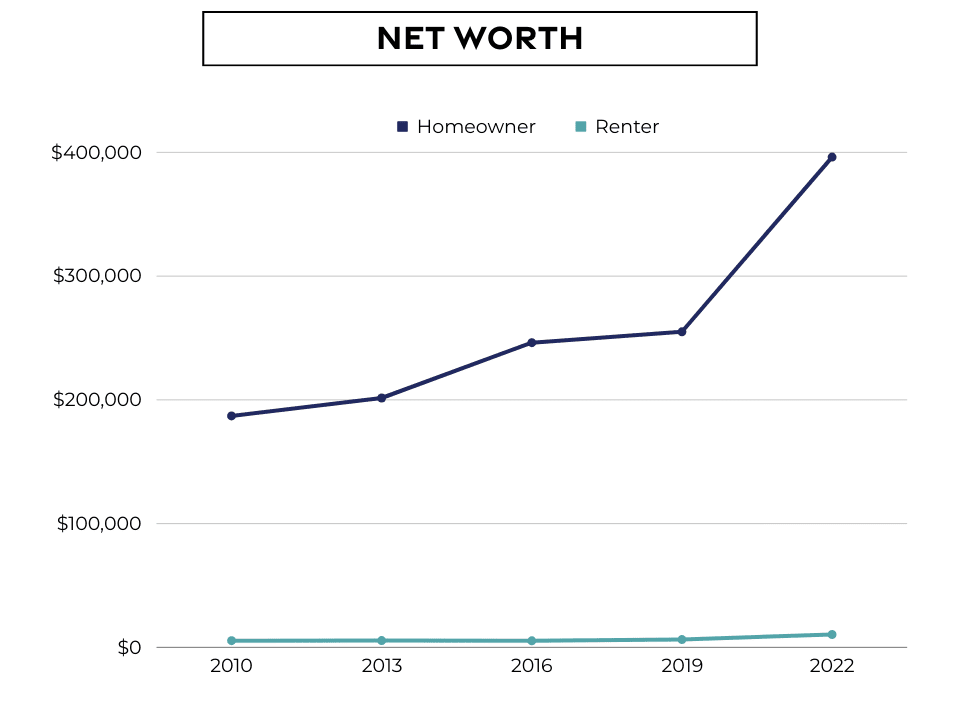
The Federal Reserve’s Study of Consumer Finances comes out every 3 years, and the difference in net worth between homeowners and renters is not only staggering, but widening.
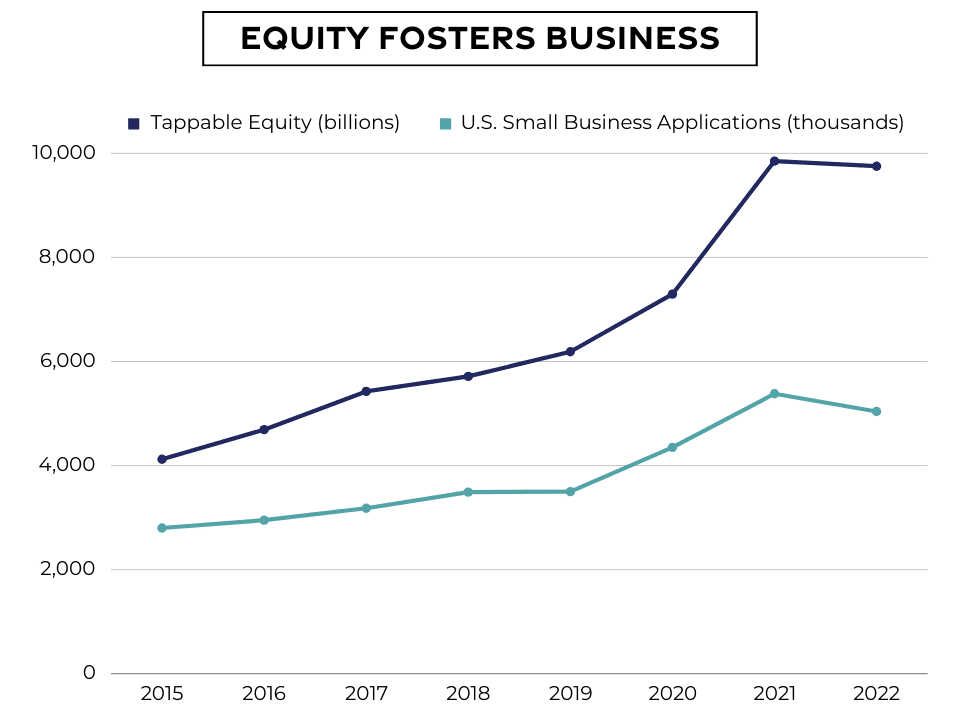
There is an extraordinary correlation between small business applications and tappable equity (80% of the home’s value). The equity you earn as a homeowner can be borrowed against to not only open a business, but to pay off debt, invest, or renovate. Your home equity can provide generational wealth and financial freedom.
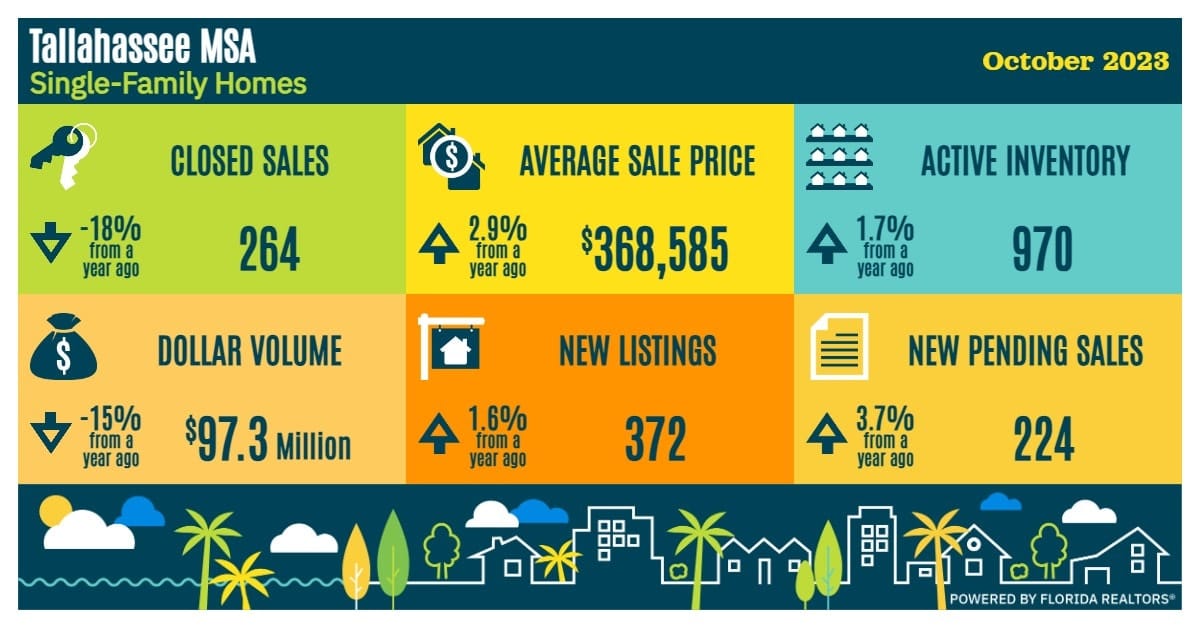
Finally, here is how we wrapped up last month in Tallahassee:
Stay up to date on the latest real estate trends.

All Real Estate News
November 11, 2026

All Real Estate News
November 10, 2026

All Real Estate News
November 10, 2026

Local Events
November 7, 2026

Local Events
November 6, 2026
All Real Estate News
November 4, 2026
You’ve got questions and we can’t wait to answer them.