October 2023 Real Estate Market Update
October 16, 2023
All Real Estate News

October 16, 2023
All Real Estate News
The current mortgage rates are the biggest concern in the real estate market right now, and near impossible to predict. Most industry experts are steering clear of forecasting where the interest rates will go. However, most projections do not fall below 7% as we enter the last quarter of 2023.
In addition to the concerning mortgage rates, there are 3 confusing myths circulating in the market.
Myth #1: Foreclosures are high.
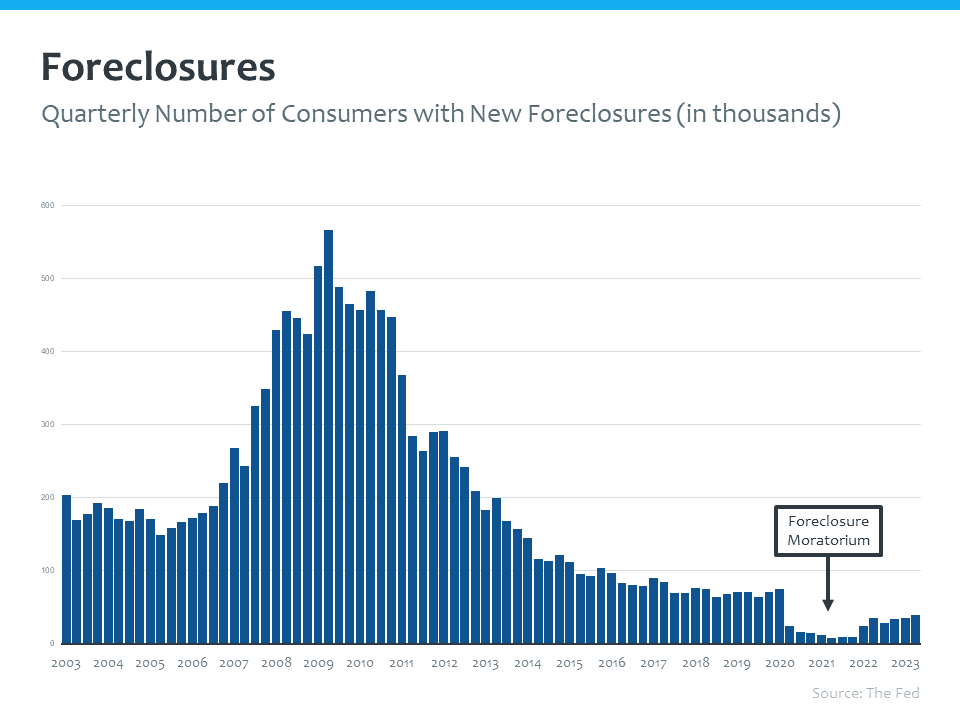
While foreclosures are increasing, it is important to put that into perspective by looking at the historical data – not just comparing foreclosure numbers to a year or two ago, which was the bottom of the foreclosure market due to the foreclosure moratorium.
During the pandemic, there was a moratorium, and it was almost impossible to foreclose on a property. Of course, leading out from that, foreclosure numbers are on the rise, but we are not in a foreclosure crisis.
Myth #2: Airbnb is going out of business, and those listings are going to crash the market.
This stemmed from a social media post that got a lot of recognition. Later, we found out the data used to explain the situation wasn't accurate.
It is true that some cities are putting major restrictions on Airbnbs, which means homeowners may consider selling or switching to long-term rental options. On the flip side, some cities are removing the cap of the number of short-term rentals.
Myth #3: Wall Street is buying every home in America.
More and more people are complaining that Wall Street is buying all the homes, and that's why there's no available inventory for buyers.
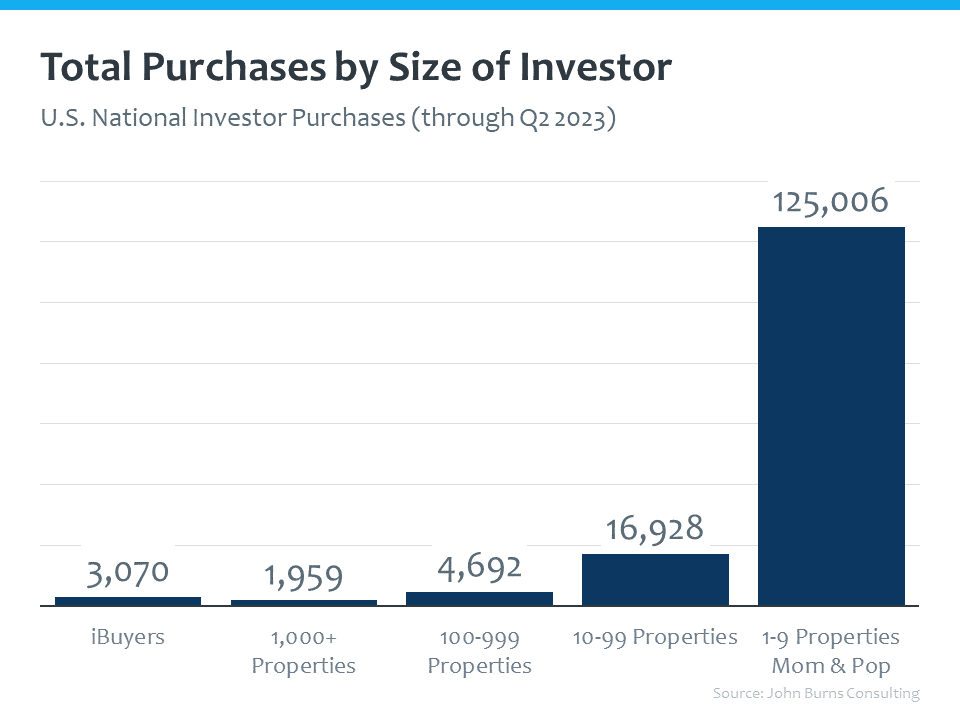
This is simply not true. Looking at the total purchases by the size of the investor, people who own less than 10 properties make up the vast majority of purchasers.
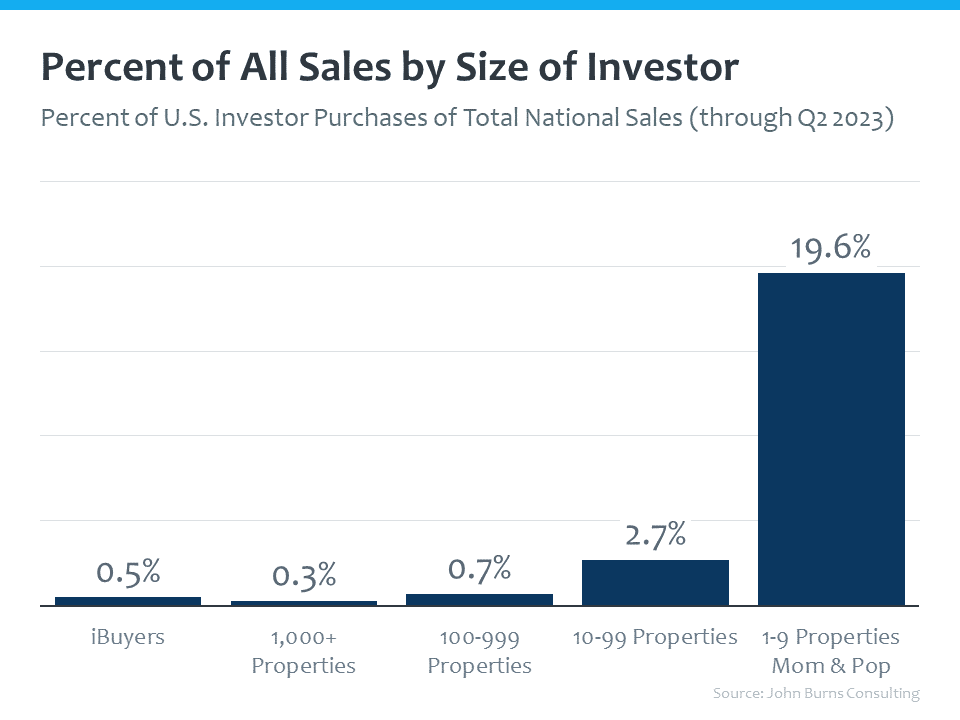
And if we take a look at that by percentages, only about 25% of homes are owned by investors.
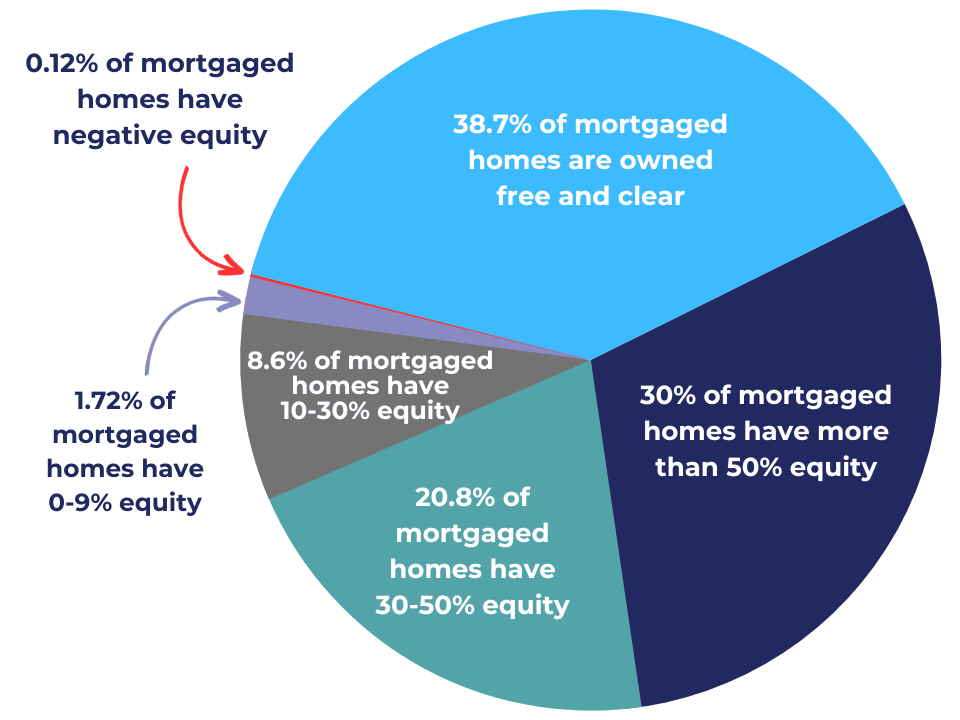
And now, let’s take a quick look at equity. There is an extraordinary amount of equity in the country right now.
According to CoreLogic’s latest equity report, there was an average quarterly equity gain of almost $14,000 per homeowner. That gives the average homeowner almost $300,000 in total home equity. Amazing! This equity gives sellers options like purchasing their next home cash or with a large down payment. A sizable down payment could mean more favorable interest rates and/or lower private mortgage insurance costs, which would ultimately reduce the overall cost of the mortgage.
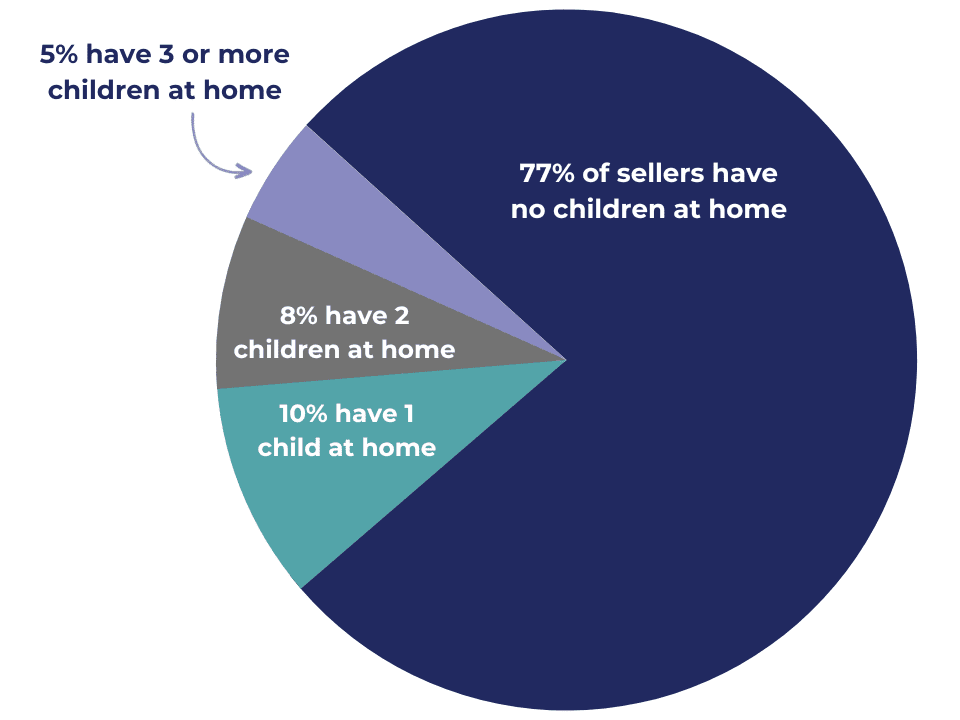
So, who is taking advantage of their equity situation right now? Empty nesters!
77% of home sellers have no children at home.
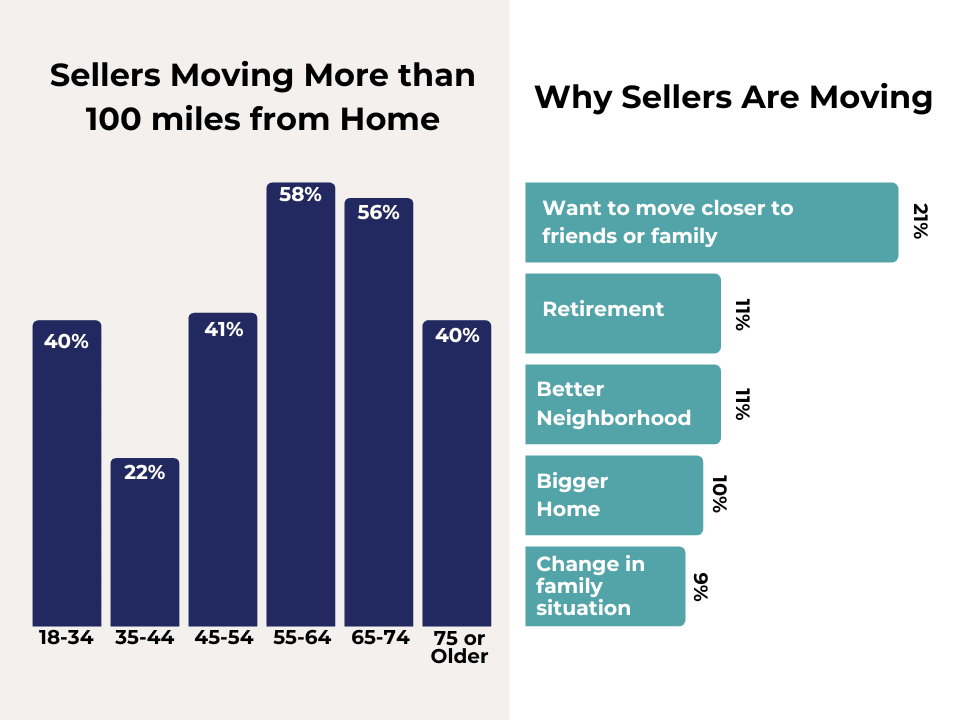
Baby Boomers make up the majority of sellers moving more than 100 miles from home, and the number one reason for moving is being closer to friends and family… Never underestimate the power of grandchildren!
We also wanted to touch on the current home price appreciation, because residential real estate’s surprisingly quick recovery suggests that the downturn is turning out to be shorter and shallower than many housing economists expected. After mortgage rates soared last year, projections had prices falling anywhere between 5 and 20%. From January through August, housing demand stabilized, resulting in relatively stable home prices.
By August 2023, national resale home prices fully recovered and now exceed the April 2022 peak. Overall, it appears the reduction in supply has outweighed the decrease in demand. Housing prices have started to increase even as sales have fallen, as appreciation is trending along the historical norm.
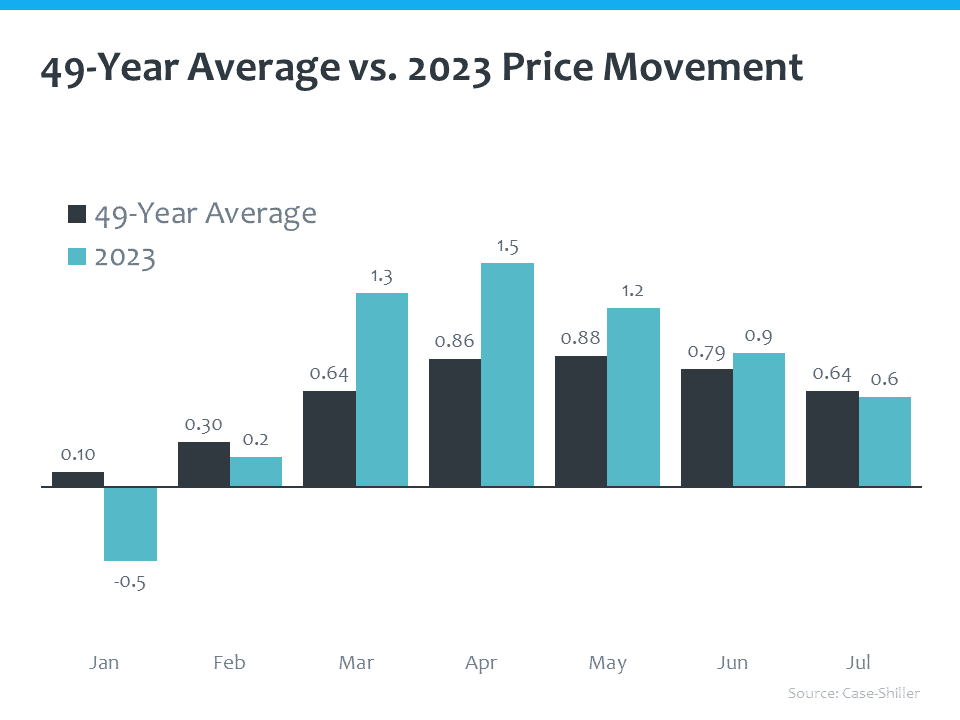
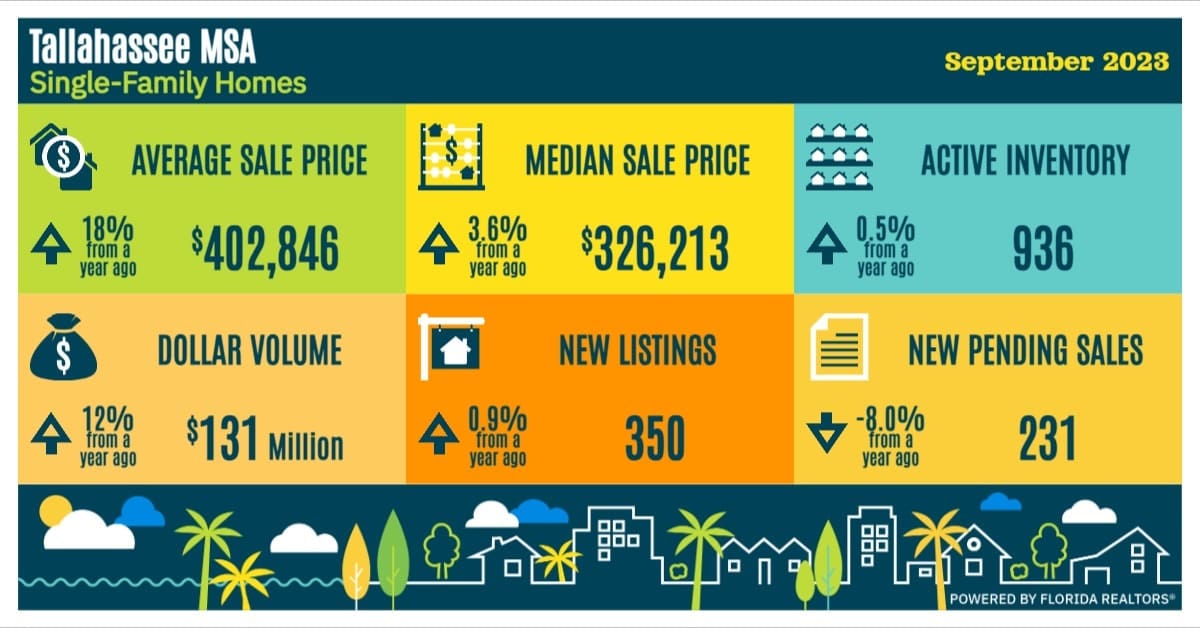
That’s great news for the country overall, but let’s not forget that varies city to city and region to region. Don’t let a crisis in another city paint the picture for yours. In Tallahassee, we had higher sales in September month-over-month and year-over-year. And, as a country, we are seeing home prices grow in line with the historical seasonal expectations.
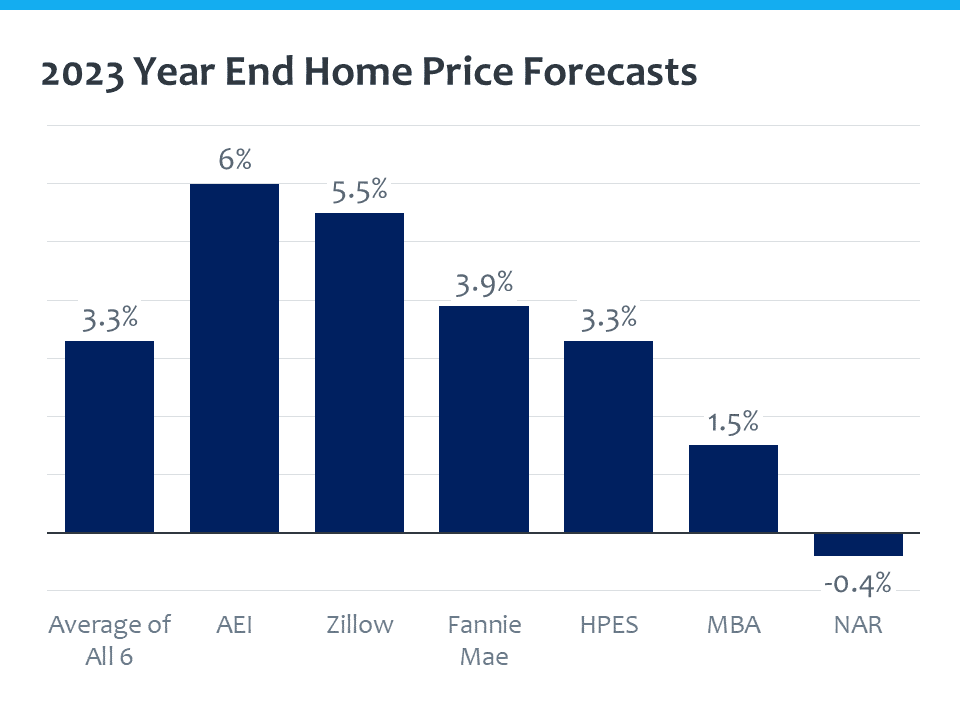
The seasonality of home prices rise during the peak summer months. The fall and winter months see lower prices – not depreciation, but a slower growth. Prices are not falling; they are just not going up as quickly as they were. This is deceleration (appreciation at a slower pace), which is the normal, seasonal trend as it has occurred for the past 49 years. So, where will home prices end up in 2023, as we enter the last quarter of the year?
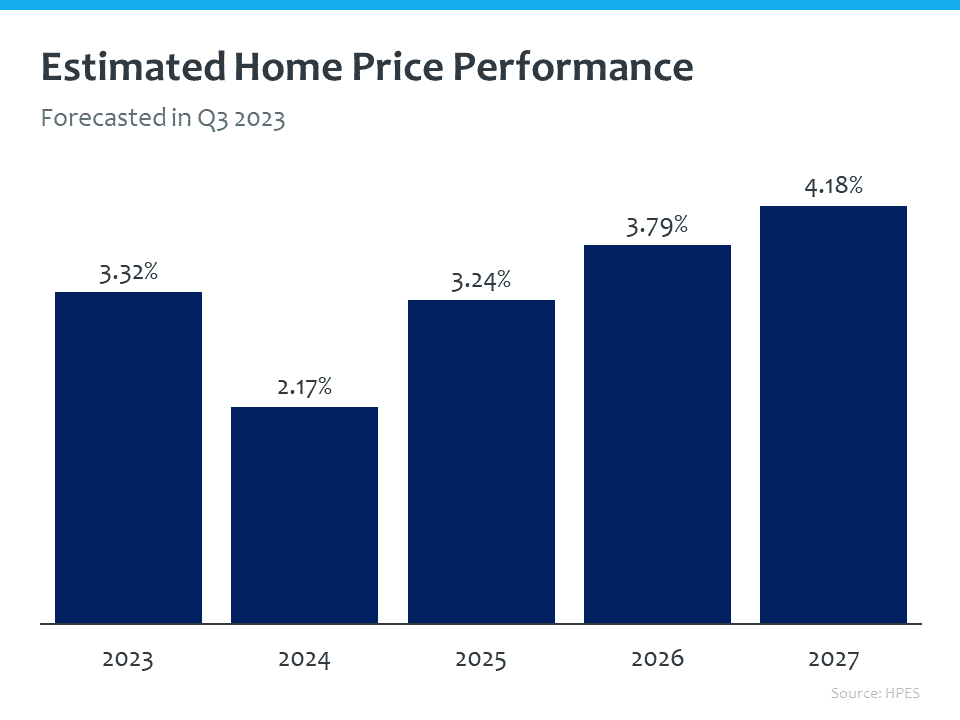
We are seeing a prediction for an average of 3.3% appreciation.
The Home Price Expectation Survey is a nationwide panel of over 100 economists, real estate experts, and investment and market strategists who project five years out. They are projecting 3.32%. Then 2024 looks like lower appreciation, but certainly not depreciation. And after home values increased 30 and 40% during and after the pandemic, it is expected for them to equalize at some point.
Finally, here is how we wrapped up last month in Tallahassee:
Stay up to date on the latest real estate trends.

All Real Estate News
November 10, 2026

All Real Estate News
November 10, 2026

Local Events
November 7, 2026

Local Events
November 6, 2026
All Real Estate News
November 4, 2026

All Real Estate News
November 3, 2026
You’ve got questions and we can’t wait to answer them.