October 2024 Real Estate Market Update
October 15, 2024
Monthly Market Updates

October 15, 2024
Monthly Market Updates
 |
June 2024 Real Estate Market Update Written By: Ivan Marquez Executive Assistant, Hum Real Estate |
This month’s report highlights key trends in the real estate market including the recent mortgage rate declines, anticipated increases in total home sales, and the impact of these factors on home prices.
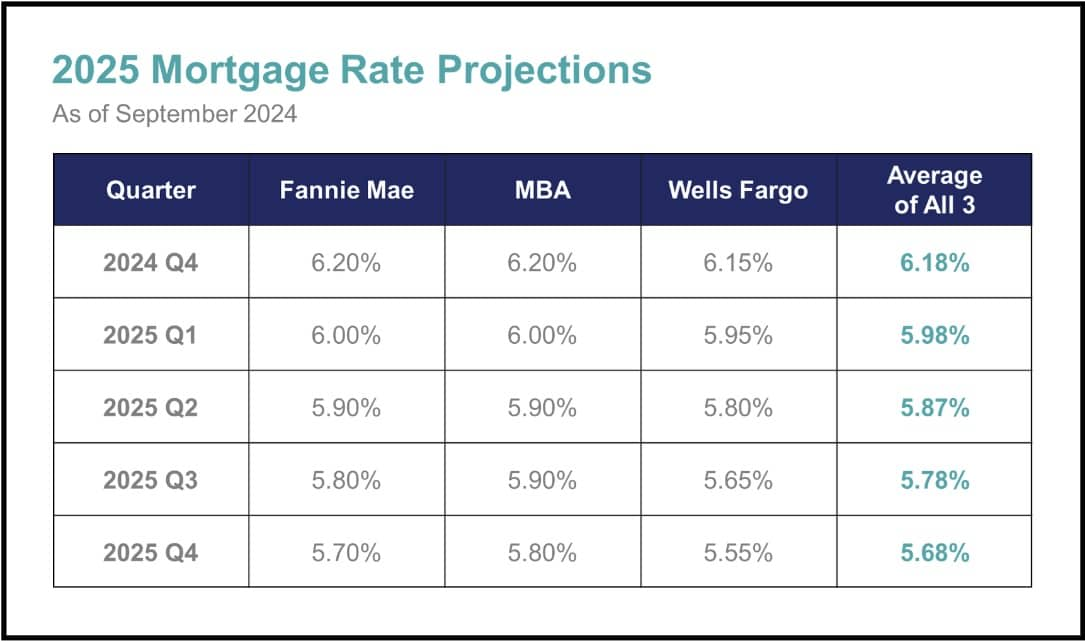
Mortgage rates are expected to ease this year, setting the stage for a more favorable home-buying market in 2025. These projections are based on economic factors (like inflation and unemployment) as well as the decisions of the Federal Reserve.
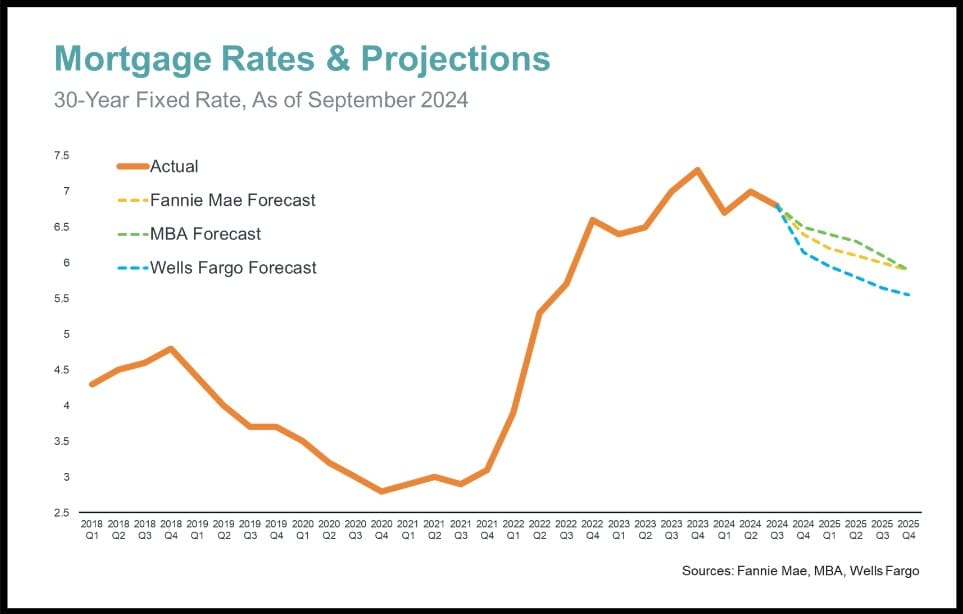
Experts from Fannie Mae, the Mortgage Bankers Association, and Wells Fargo project rates may drop to the mid-to-high 5% range by 2025, offering slight improvements in affordability and signaling better opportunities for buyers.
Mortgage rates are expected to continue their downward trend, easing off last year’s peak but not returning to the historic lows of 2020 - 2021. As financing costs decrease, buyers who were sidelined by affordability concerns may re-enter the market.
Recent research highlights a significant increase in buying power for potential homebuyers. For example, on a $500,000 loan, the monthly mortgage payment has decreased by about $500 compared to the same time last year. This notable change enhances affordability and opens up new opportunities for buyers as mortgage rates continue to ease, though with some volatility, it is important for buyers to understand the difference it makes in their purchasing power.
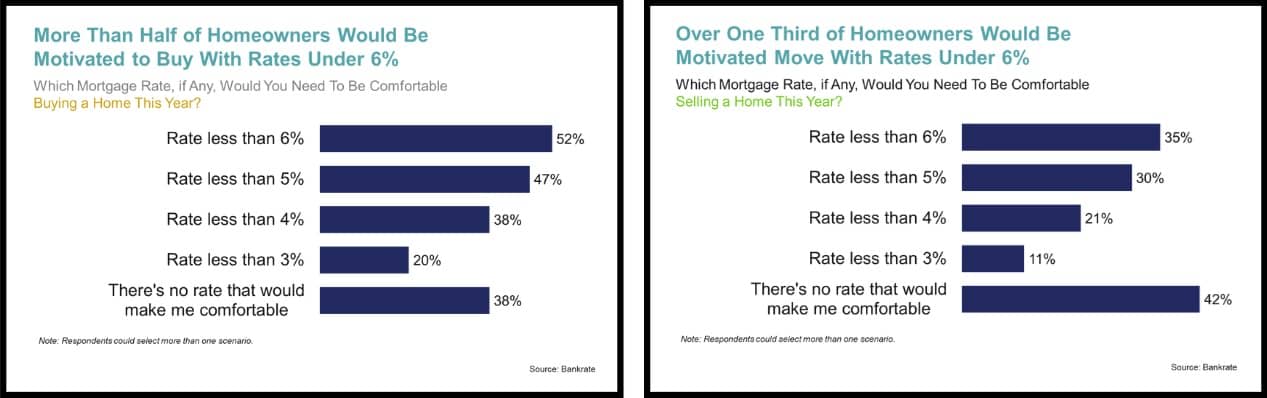
A recent survey by Bankrate reveals that more than half of homeowners would be motivated to buy a home if rates fall below 6%, and over one-third of homeowners would consider selling. This shift could lead to an increase in both buyer and seller activity, which would provide more inventory and boost the overall real estate market.
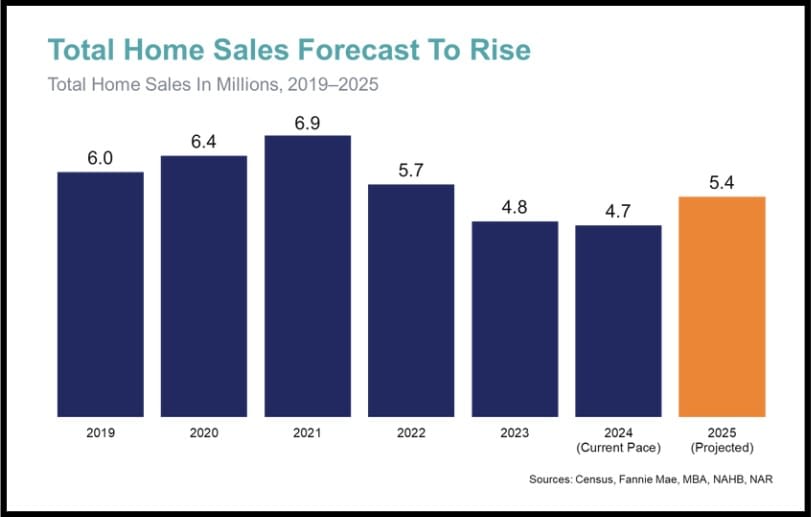
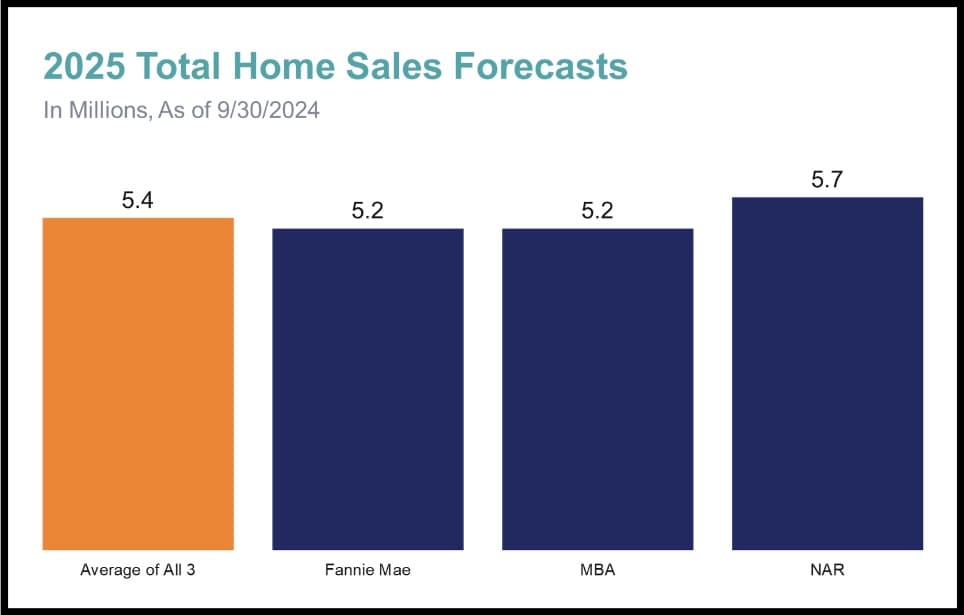
Total home sales are forecasted to rise in 2025, with projections indicating about 4.7 million homes will be sold in 2024. Over the past few years, higher borrowing costs and prices have contributed to a decline in sales, but experts expect an increase to around 5.4 million homes sold next year. Factors like increasing home construction, easing financing costs, and moderating prices signal a positive shift for the housing market.
As mortgage rates shift and inventory increases, there will be more competition in the market.
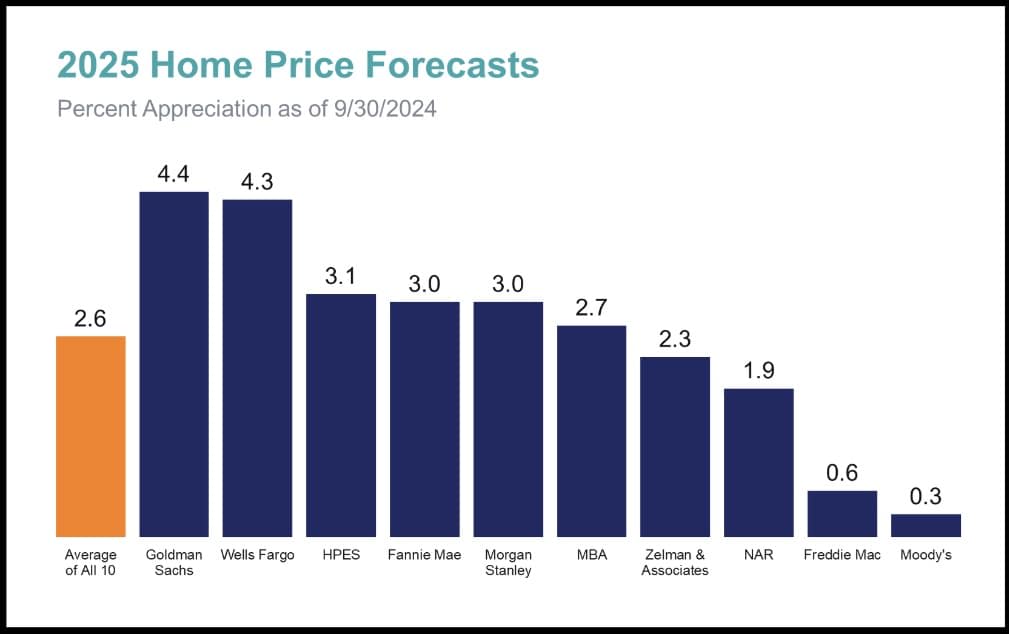
Home prices are expected to see moderate appreciation in 2025, with forecasts from major sources suggesting an average of 2.5% to 4%. While this is a much healthier and sustainable rate compared to the steep increases seen in previous years, the ongoing inventory shortage will continue to apply upward pressure on prices. Although inventory is slowly growing, it remains insufficient to meet the increasing demand from buyers, which is one of the factors contributing to this appreciation.
However, it’s essential to recognize that home price trends vary across regions. While some areas may see significant price increases, others could experience more stability or even mild declines.
Being familiar with your market’s trends is crucial.
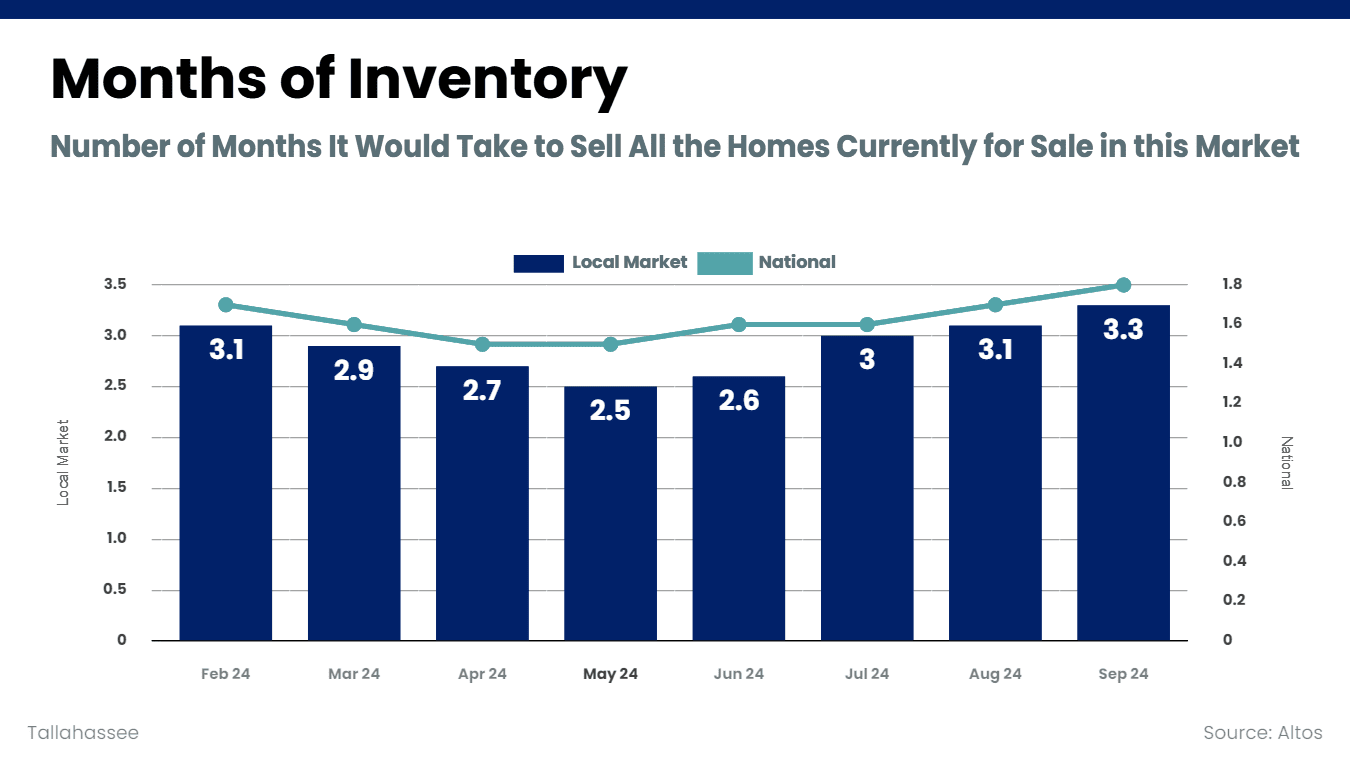
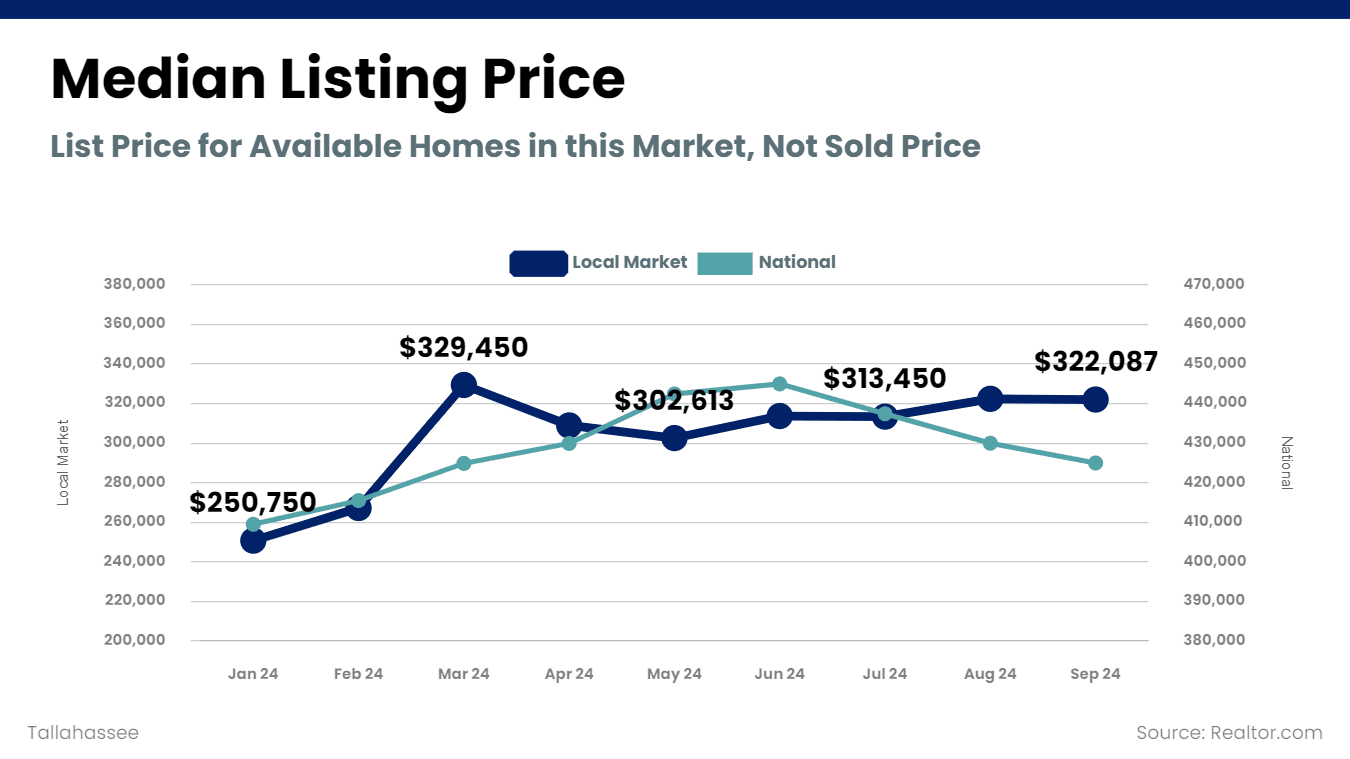
While Tallahassee seems to be following the national trends when it comes to inventory, that is not the case when it comes to home prices.
Locally, we are seeing a slightly lower median listing price than the average for the country overall - further indication that now may be a good time to buy. For sellers, it is coincidentally also a perfect time, because as mortgage rates trend lower, buyers are reentering the market. As buyers reenter the market, inventory may begin to increase as sellers see the opportunity to list their homes for sale. Being on the front end of this market shift will bode well for sellers.
Mortgage rates are volatile, but moving closer to a decreasing trend. While home sales may end up being a number closer to last year’s total home sales, next year we are forecasted to see a much busier market. Home prices have seemed to return to their more normal, historical level of appreciation.
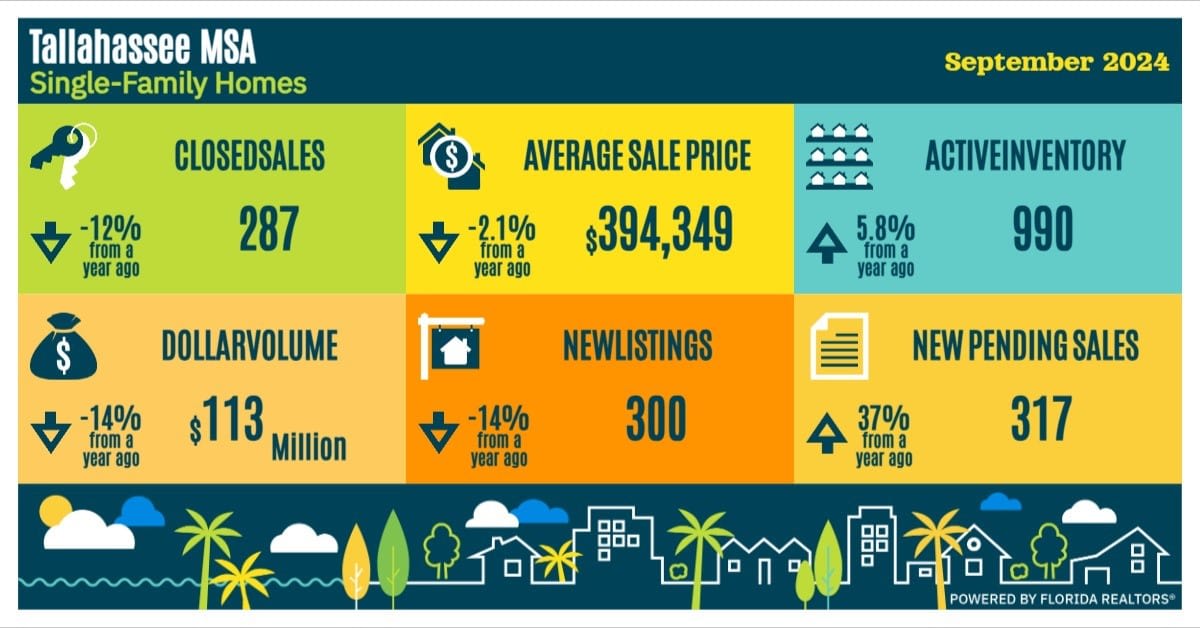
Tallahassee Market Statistics:
Stay up to date on the latest real estate trends.

All Real Estate News
October 23, 2026

All Real Estate News
October 23, 2026
All Real Estate News
October 21, 2026

All Real Estate News
October 20, 2026

Articles for Buyers
October 19, 2026

October 19, 2026
You’ve got questions and we can’t wait to answer them.