September 2022 Real Estate Market Update

September 27, 2022

Monthly Market Updates

September 2022 Real Estate Market Update
The top three concerns in the housing market right now are mortgage rates, home prices, and affordability.
 
This is a look at the Freddie Mac 30-year fixed rate going all the way back to January of 2022. It shows is how much mortgage rates really rose from the beginning of the year all the way into mid- to late-Junish, and then since then, you can see that there’s been a lot of volatility or fluctuation in mortgage rates over the past few months. So, why is that? Inflation is the enemy of long-term interest rates. We know that the Federal Reserve doesn’t call mortgage rates, but they’re certainly making moves right now to ease inflation, and when that happens, mortgage rates tend to response. So, we’re watching all of the different economic factors that impact mortgage rates and how that’s playing out over time.  https://freddiemac.gcs-web.com/node/25841/pdf http://www.freddiemac.com/pmms/
 
This year the housing market has truly been defined by rising mortgage rates. Taking a look at the Freddie Mac 30-year fixed rate, we can clearly see the jump earlier this year from 3.22% to over 5%. There has been a tremendous amount of volatility in mortgage rates over the past few months. This is because inflation is the enemy of long-term interest rates. The Federal Reserve is making moves to ease inflation, and when that happens mortgage rates respond.
 
“What are the projections for going forward?” Everyone wants to know: where are mortgage rates headed? Well, if we look at these projections, from Freddie Mac, Fannie Mae, MBA and NAR, these are the latest data we have as of August of this year, and if we average all of their projections together over the next four quarters, what we can see mortgage rates are projected to essentially stabilize over the next year.  https://www.freddiemac.com/research/forecast/20220720-quarterly-forecast-market-slowdown-will-continue-high-rates-and-prices-exacerbate https://www.fanniemae.com/media/44466/displayhttps://www.mba.org/docs/default-source/research-and-forecasts/forecasts/mortgage-finance-forecast-aug-2022.pdf https://cdn.nar.realtor/sites/default/files/documents/forecast-q3-2022-us-economic-outlook-07-27-2022.pdf
 
The general consensus is that the Federal Reserve is going to get inflation under control. If that’s the case, then mortgage rates will stabilize to about 5.3%, and then dipping below 5% in the third quarter of next year.
 
I don’t think national housing prices will decline in a meaningful way... but there will be some price declines across the country.  Mark Zandi, Chief Economist, Moody’s Analytics
 
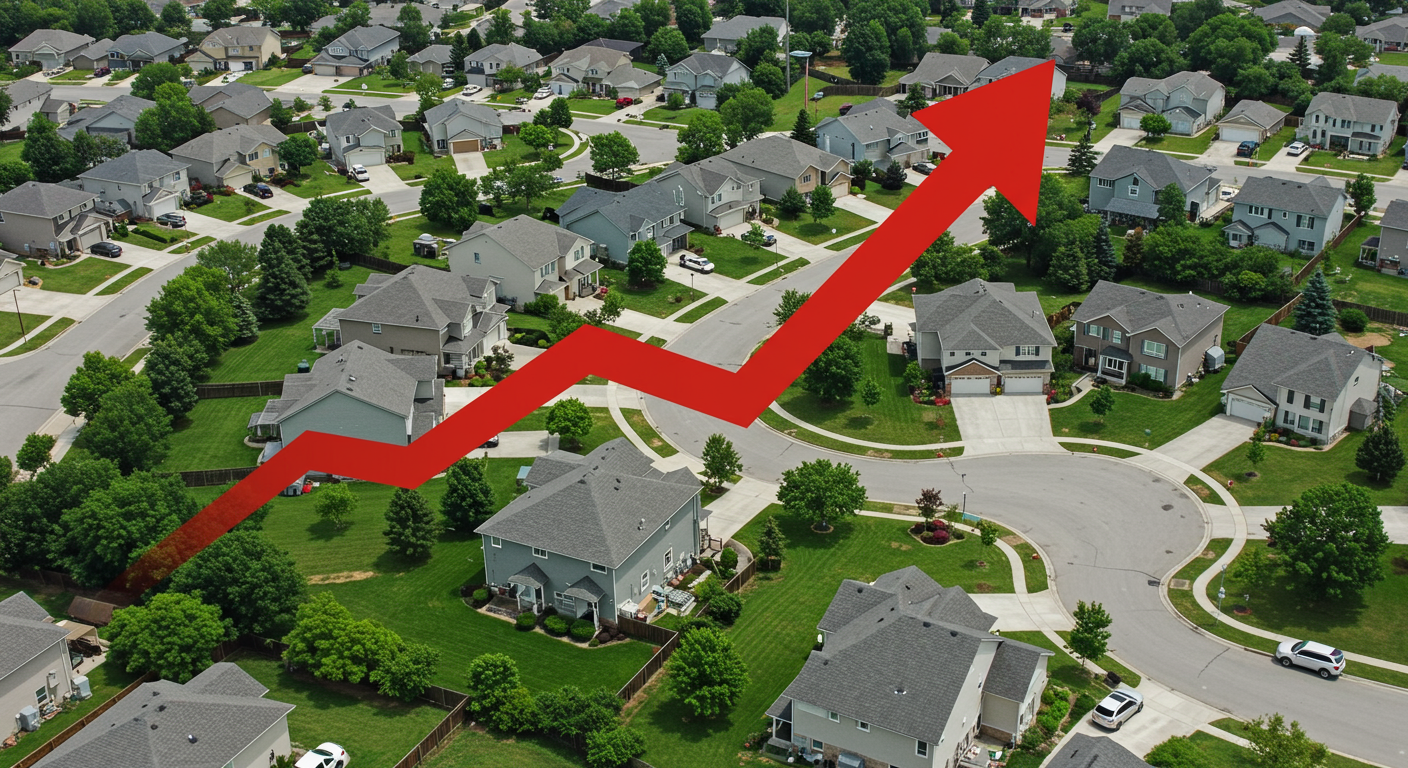
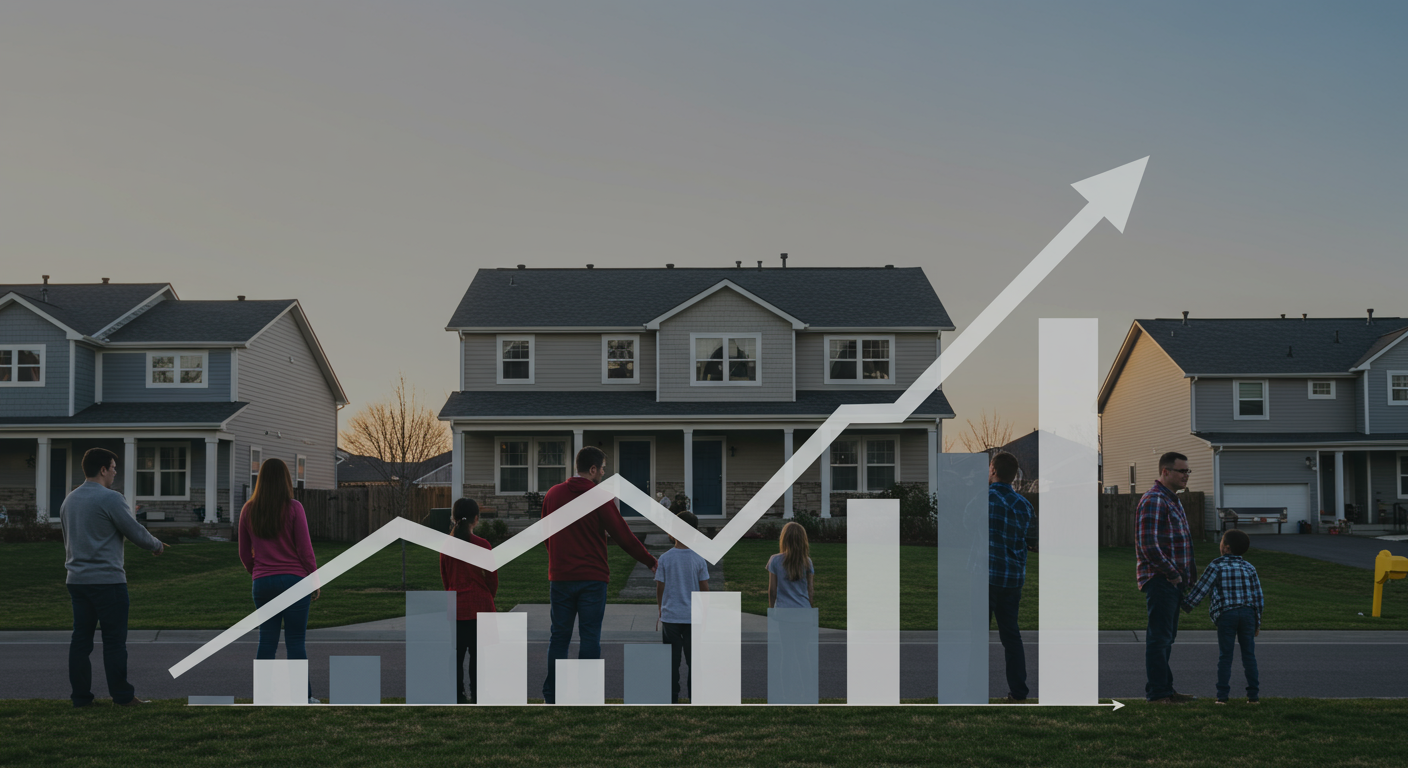
Home prices are appreciating, but at a slower, more moderate rate than we have seen recently.
 
I don’t think national housing prices will decline in a meaningful way... but there will be some price declines across the country.  Mark Zandi, Chief Economist, Moody’s Analytics
 
Nationally, home prices will continue to rise due to buyer demand and low inventory.
 
On average, nationally, we project that home prices will continue to rise. We’re seeing that in expert projections, but at the same time, we also know that there are some overheated markets throughout the country, especially out on the West Coast where there will likely be price declines, and you’re probably seeing this in some of your markets right now. And so, I want to bring context to this to show how home-price appreciation is still expected going forward based on today’s buyer demand and low inventory, but what does that mean in the grand scheme of things? Depreciation is slowing not depreciating, and that’s where deceleration comes into play. This is percent year-over-year of home price increases for 2022 so far, and this is data from CoreLogic. Latest data was just released, and so, what you can see here is that year-over-year, January, February, and March, home prices were still accelerating at a pretty rapid pace, record-breaking home-price appreciation at the beginning of this year, but what has happened since then? We’ve come off that high of 20 percent year over-year home-price appreciation, and it’s starting to cool. And that’s what you can see in May, June, July. That’s the deceleration in prices. So, what this means is year-over year, July, let’s say July of this year compared to July of last year, home prices were still 15.8 percent higher on the national average compared to last year, but that’s a slower pace than that high of over 20 percent that we saw at the beginning of the year, end of last year. So, the pace of appreciation is slowing. That’s deceleration. It’s not depreciation where we would have negative price growth.  https://www.corelogic.com/intelligence/u-s-home-price-insights-september-2022/
 
Home prices are slowing – not depreciating, and that’s where deceleration comes into play. We saw record-breaking home-price appreciation at the beginning of this year, and we have recently seen (and will continue to see) a deceleration of home prices. The pace of appreciation is slowing. That’s deceleration. It’s not depreciation – where we would have negative price growth. We will see continued appreciation at a slower pace. This gives buyers a little bit more negotiating power.
 
Annual home price growth slowed for the third consecutive month in July but remained elevated at 15.8%. As 30-year, fixed-rate mortgages neared 6% this summer, some prospective homebuyers pulled back, helping ease overheated and unsustainable price growth... Looking ahead, CoreLogic expects to see a more balanced housing market, with year-over-year appreciation slowing to 3.8% by July 2023. CoreLogic, Latest Home Price Insights Report
 
The past two years have been an anomaly. The price growth over the past year was unsustainable.
 
Looking ahead, CoreLogic expects to see a more balanced housing market with year-over-year appreciation slowing to 3.8 percent by July of 2023. So, by July of next year, CoreLogic is projecting that homes will still be appreciating in value, but at a much slower pace. That’s that deceleration continuing, and this is much more in line with what we’re seeing from the home price expectations survey and what they are saying for continued price growth, higher this year and a little bit more towards a normal range next year and beyond.   https://www.fanniemae.com/research-and-insights/forecast/forecast-monthly-archive  https://www.freddiemac.com/research/forecast?page=0  https://www.nar.realtor/research-and-statistics  https://zelmanandassociates.com (subscription necessary) https://pulsenomics.com/surveys/#home-price-expectations https://www.mba.org/news-and-research/forecasts-and-commentary/mortgage-finance-forecast-archives
 
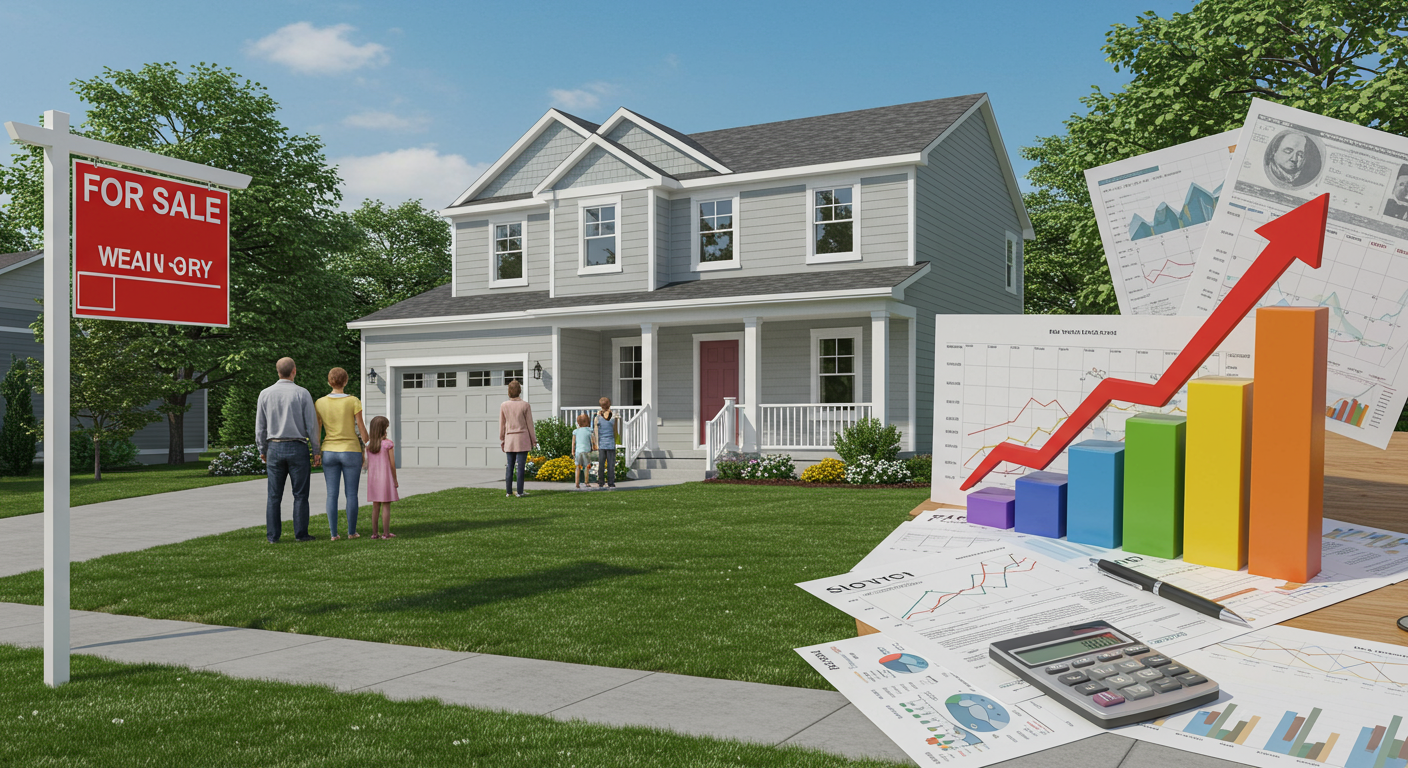
Many experts raised their home price forecast this year. Most likely because of the continued low inventory levels and the increasing mortgage rates.
 
We bring this graph to you often to show you the latest home-price projections for the year, and the average of all seven forecasts that we follow is showing 11.3 percent annual appreciation for 2022. Now, what we have to remember is that the majority of that home-price appreciation happened earlier this year. It happened at the beginning of the year, and we’re seeing that softening, but experts still projecting by the end of the year, 11.3 percent home-price appreciation for 2022. So, why is that? Well, that’s because inventory is still historically low.   https://www.fanniemae.com/media/44461/displayhttps://www.freddiemac.com/research/forecast/20220720-quarterly-forecast-market-slowdown-will-continue-high-rates-and-prices-exacerbate https://cdn.nar.realtor/sites/default/files/documents/forecast-q3-2022-us-economic-outlook-07-27-2022.pdf https://www.corelogic.com/intelligence/find-stories/corelogic-hpi-posted-record-year-over-year-growth-in-2021/ https://pulsenomics.com/surveys/#home-price-expectations https://www.zelmanassociates.com/ (subscription required) https://www.mba.org/docs/default-source/research-and-forecasts/forecasts/mortgage-finance-forecast-aug-2022.pdf
 
We are looking at 11.3% annual home price appreciation for 2022, keeping in mind a lot of that already happened at the beginning of this year.
 
This data from Calculated Risk, this helps us compare where we are today versus where we were over the past few years. Inventory is 26.3 percent higher than it was the week ending September 2nd of last year, so year-over-year, comparison for the last week of August and into the first couple days of September, 26.3 percent more inventory. So, that is creating more opportunities for buyers. It has helped with the softening of home prices, for sure, but compared to the same week in 2020, inventory is still down 5.4 percent, and compared to 2019, prior to the pandemic, inventory is still historically low, down 42.2 percent from where we were that same week in 2019. So, that’s what’s continuing to drive upward pressure on home prices. Inventory is still low. We still have buyers in the market. Yes, we’ve seen a softening, a cooling, a slowing. But home prices are projected to continue rising primarily based on this inventory data as well.   https://www.calculatedriskblog.com/2022/09/housing-september-5th-update-inventory.html
 
Inventory is 26.3% higher than it was last year, which creates more opportunities for buyers. However, compared to the same week in 2020, inventory is down 5.4%, and down 42.2% from the same week in 2019. Historically, inventory is still low, and that’s what’s continuing to drive an upward pressure on home prices.
 
The housing affordability index released by NAR every month. Housing affordability right now is lower than it’s been going all the way back to the early ‘90s. This is a look at the — going back to 1990 and housing affordability. The high of that market, the housing affordability index read 197. Right now, we’re at 98.5. 100 reading of the housing affordability index is an even reading. That means the average individual, the average household, in this country can afford 100 percent of the average mortgage payment. You make enough money to afford an average home, and that is even affordability, and we’ve gotten a lot of cover from interest rates over the last several years and seen great affordability. And right now, the average household can afford 98.5 percent of the average mortgage payment, so less affordable. You could maybe even say unaffordable. You may see that some places, and that’s where that comes from, but certainly not an apocalyptic scenario by any means in housing affordability. Now, that’s based upon three things. It’s based on the prices of homes. It’s based on interest rates, and it’s based on wages. That’s how they come up with the housing affordability index.  https://www.nar.realtor/blogs/economists-outlook/housing-affordability-conditions-fade-as-mortgage-rates-push-monthly-payments-higher-in-june-2022
 
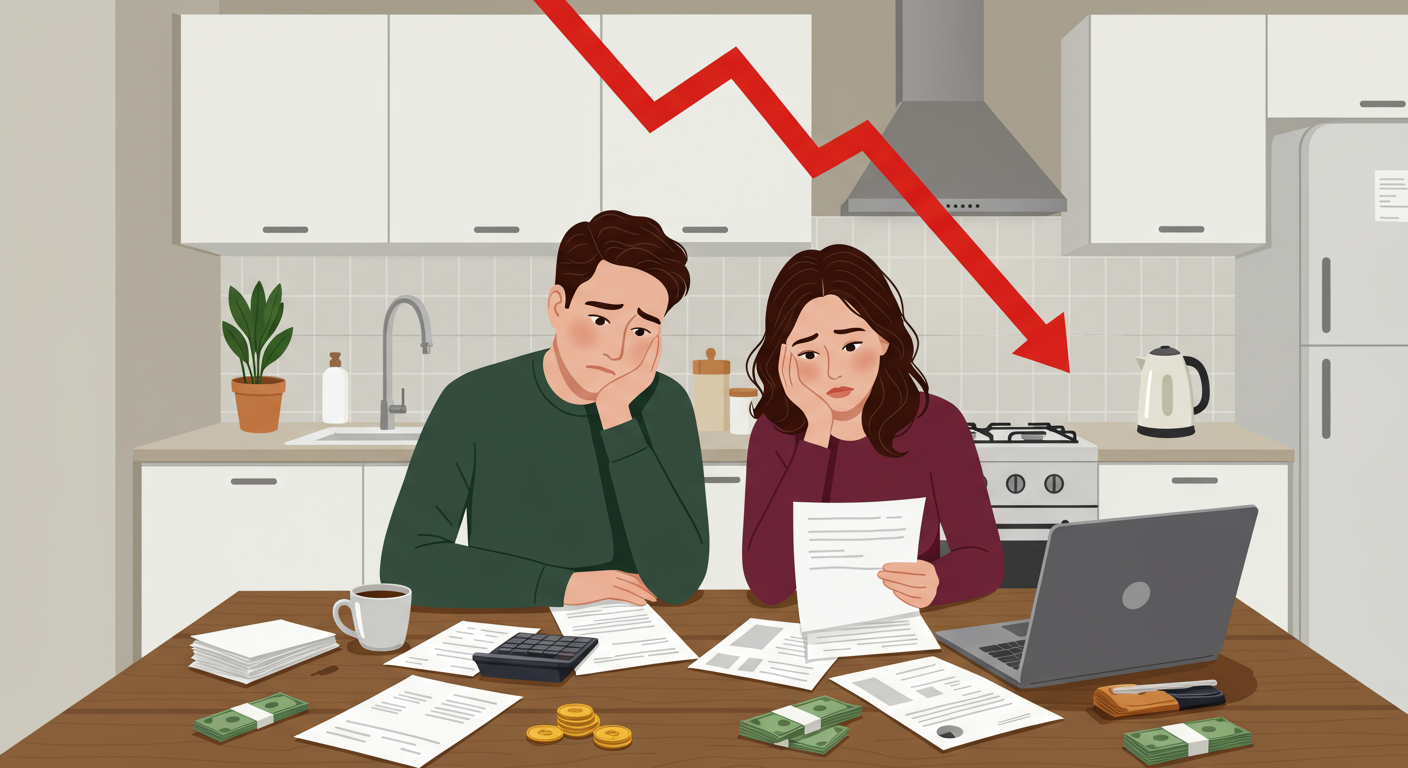
Housing affordability is lower than it’s been since the early 1990s. The National Association of Realtors® Housing Affordability Index, is based on 3 things: home prices, interest rates, and wages – where the higher the bar, the more affordable a home. A reading of 100 is an even reading – where the average household can afford 100% of the average mortgage payment. As right now, the average household can afford 98.5% of the average mortgage payment – so, unaffordable.
 
Compared to one year ago, the monthly mortgage payment rose from $1,265 to $1,944 - an increase of 53.7%. There is no doubt that homes are less affordable right now.    https://www.nar.realtor/blogs/economists-outlook/housing-affordability-conditions-fade-as-mortgage-rates-push-monthly-payments-higher-in-june-2022 https://cdn.nar.realtor/sites/default/files/documents/hai-06-2022-housing-affordability-index-2022-08-11.pdf
 
Compared to one year ago, the monthly mortgage payment rose from $1,265 to $1,944 – an increase of 53.7%. There is no doubt that homes are less affordable right now.
 
Another thing that we want to look at when we start to break down affordability and understand that is we want to look at what is the average mortgage payment or income committed to a mortgage payment, and right now, that sits at 25.4 percent. That assumes a 30-year fixed mortgage rate with a 20 percent down payment on a median-priced home with median income. So, go back to the affordability equation. The median income, the median-priced home, somebody is dedicating 25.4 percent of their income to a housing payment. Why is that important? Well, if you look at this, 25 percent is typically what is recommended. We’re slightly above that. Again, I’m going to go back to not an apocalyptic scenario, but above that, and so, if you hear that word “affordability” coming out, you can give context to that and what that means.  Purchased data from NAR https://www.nar.realtor/blogs/economists-outlook/housing-affordability-conditions-fade-as-mortgage-rates-push-monthly-payments-higher-in-june-2022
 
Another thing that we want to look at when we start to break down affordability is the average mortgage payment, or income committed to a mortgage payment, which sits at 25.4%. This assumes a 30-year fixed mortgage rate with a 20% down payment on a median-priced home with median income. 25.4% of income is dedicated to a housing payment, where 25% is typically what is recommended.
 
If we further break this down, if you look at median household income versus qualifying income, here’s what becomes very, very clear is this is not the same across the country. If you go look to the West, the qualifying income, what you need to make to buy a home, is in the West, certainly, significantly higher than what the median income is. If you read this, in the West are less affordable. In the South, they’re neck and neck. In the Midwest, median income is higher than the qualifying income.   https://www.nar.realtor/blogs/economists-outlook/housing-affordability-conditions-fade-as-mortgage-rates-push-monthly-payments-higher-in-june-2022
 
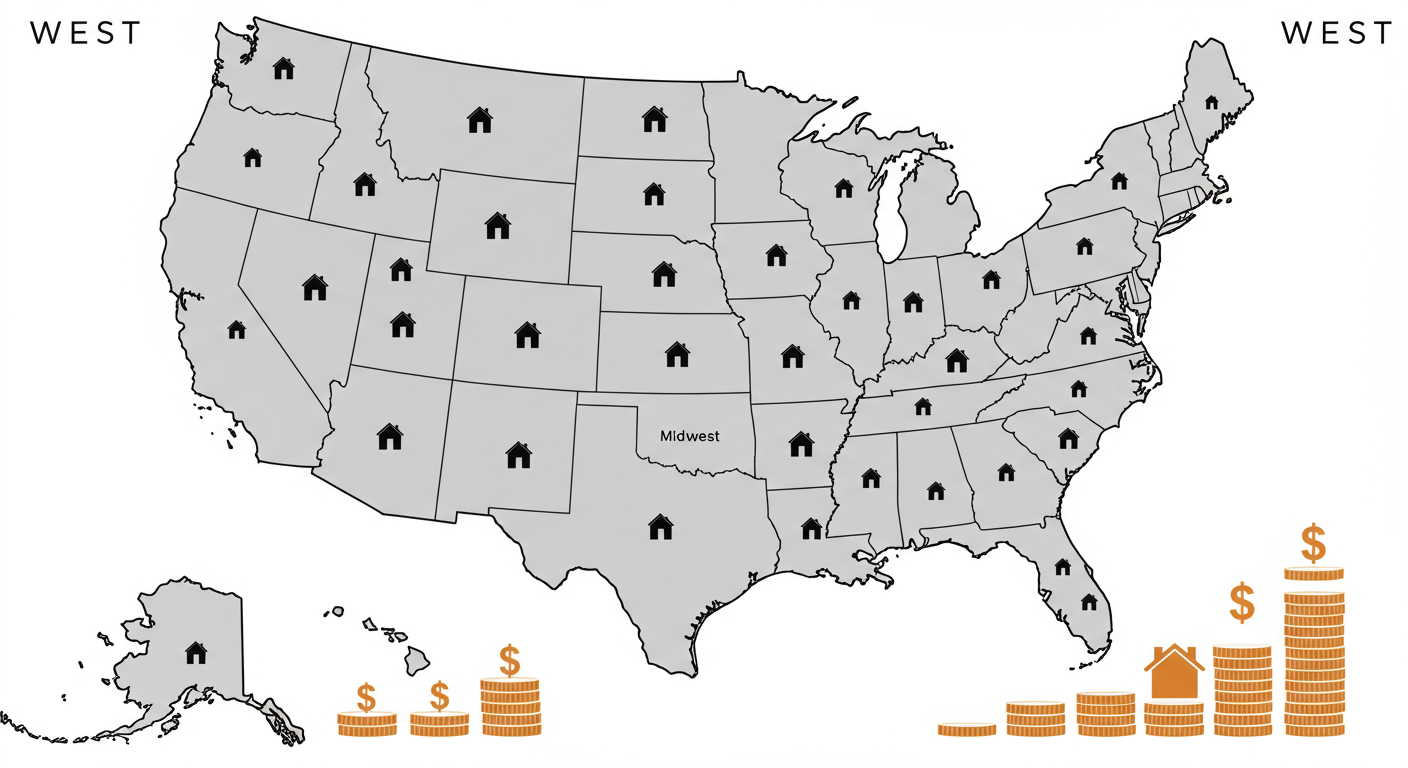
Taking a look at median household income versus qualifying income – what you need to make to buy a home, is pretty even for the South which is following the national trend.
 
3 things buyers can do today:  Expand search area and criteria  Explore alternative financing options  Look for grants, gift funds, etc. @ downpaymentresource.com
 
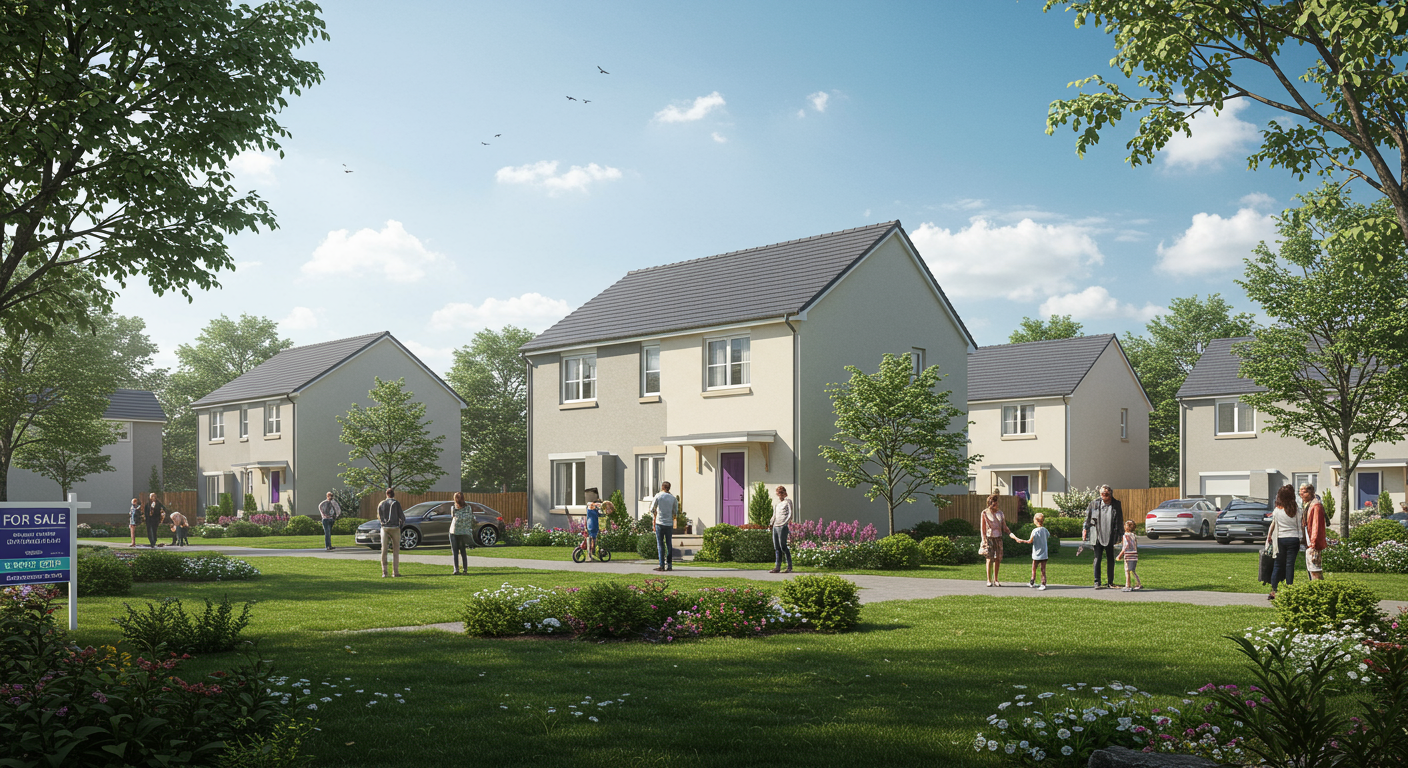
To combat the current housing affordability right now, buyers can expand their search area and criteria – maybe consider looking a little bit further out of their desired area. Or explore alternative financing options with several different lenders. Finally, buyers can look for grants at sources like DownPaymentResource.com.
 
Housing is traditionally one of the first sectors to slow as the economy shifts but is also one of the first to rebound.  Ali Wolf, Chief Economist, Zonda

Follow Us on Instagram

Let’s Talk

You’ve got questions and we can’t wait to answer them.