September 2023 Real Estate Market Update
September 15, 2023
All Real Estate News

September 15, 2023
All Real Estate News
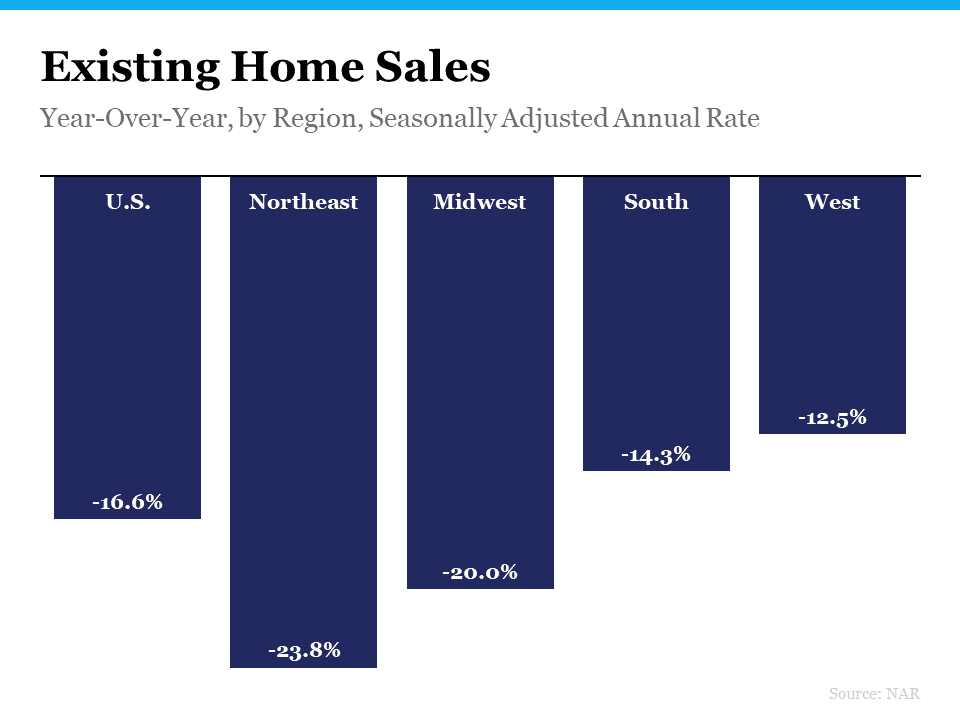
Nationally, home sales are down 16%. The two factors driving this are inventory and mortgage rates.
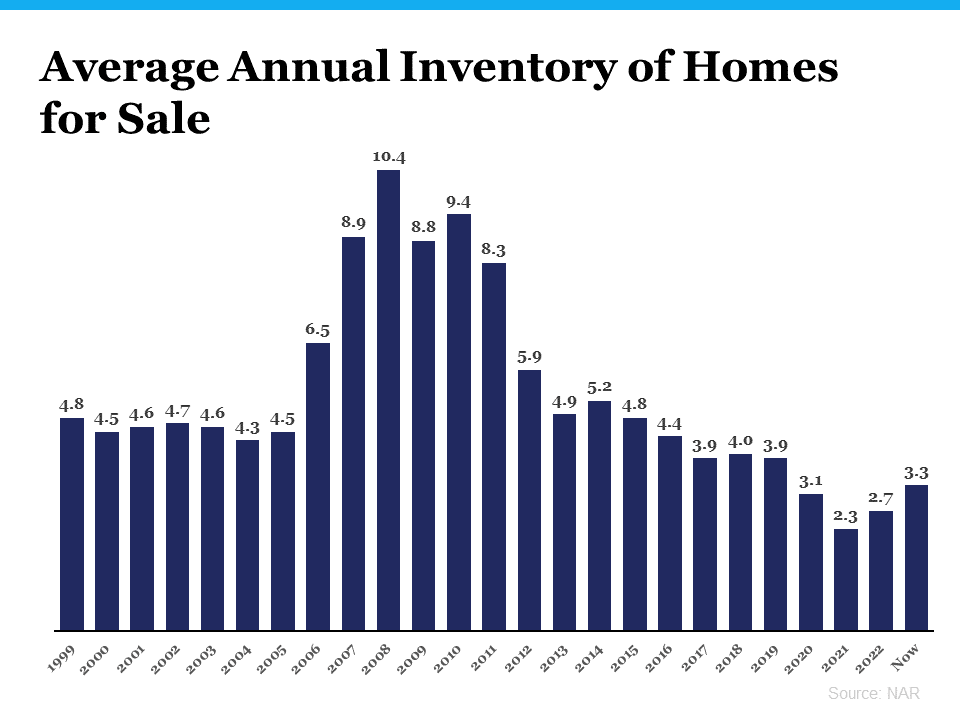
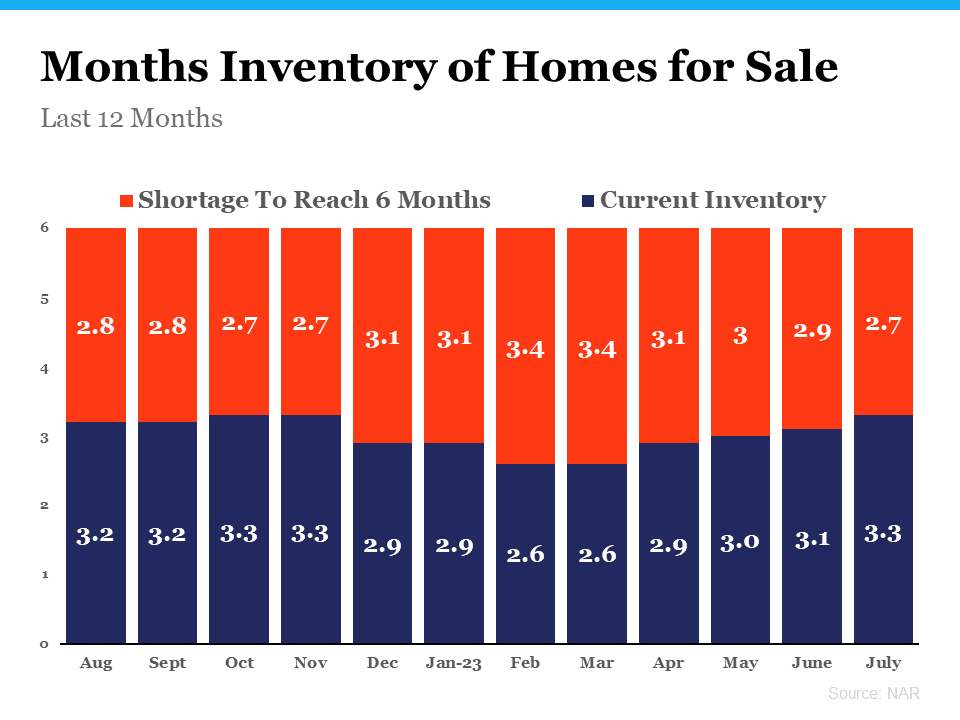
Mortgage rates are volatile right now, and the market has struggled with not having enough inventory for a long time. Inventory is measured by months-on-hand, or the number of months it would take for the current homes for sale to sell at the current sales pace. A balanced market has about 5 to 6 months of inventory on hand. A low months-on-hand puts an upward pressure on sales prices, and gives sellers the upper hand (a seller’s market). A high months-on-hand puts a downward pressure on sales prices, and gives buyers the upper hand (a buyer’s market). We have not seen 6 months inventory on hand in 11 years. We haven’t seen 5 months inventory on hand in 8 years. We are in a clear seller’s market, and that puts an upward pressure on home prices.
There are people who think that, because of technology and the quickness in which we can do things now, maybe a balanced market should be 4.5 months-on-hand. Despite the fact that the leading industry experts all still use the 5 to 6-month benchmark, let’s entertain this 4.5 months-on-hand anyway. Guess what? It’s been 7 years since we have seen even just 4.5 months-on-hand. There are simply not enough homes for sale.
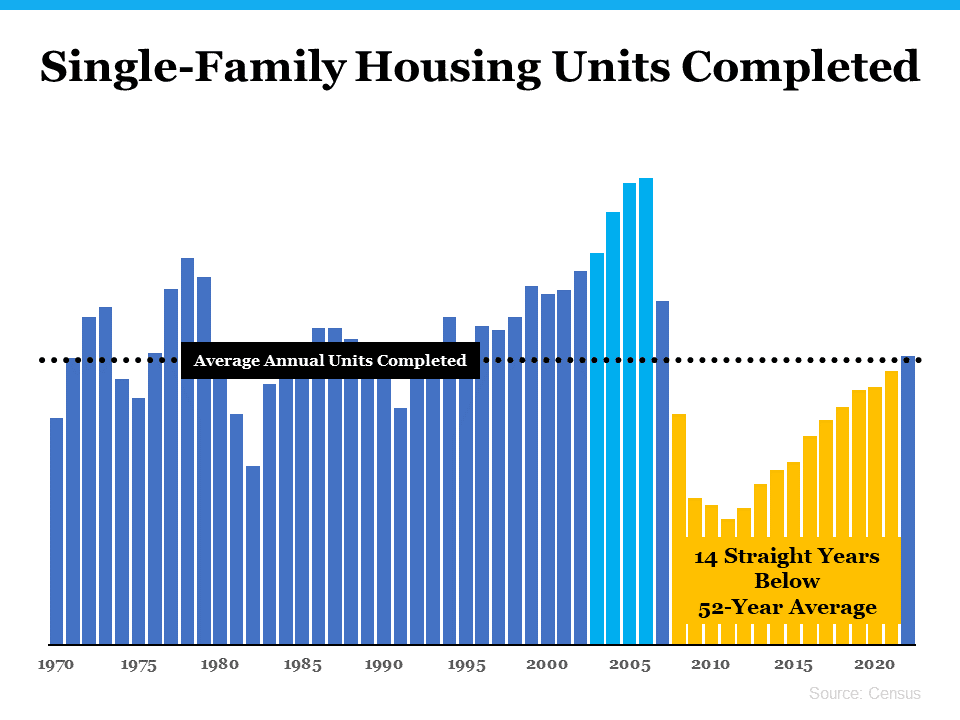
One thing that has contributed to the inventory shortage is new construction. Builders overbuilt and, like many, were hurt during the crash. The 52-year average of newly constructed single-family homes is 1,009. For 14 straight years, we were below that average. However, in 2022, we saw 1,022 single-family housing units completed – a good sign.
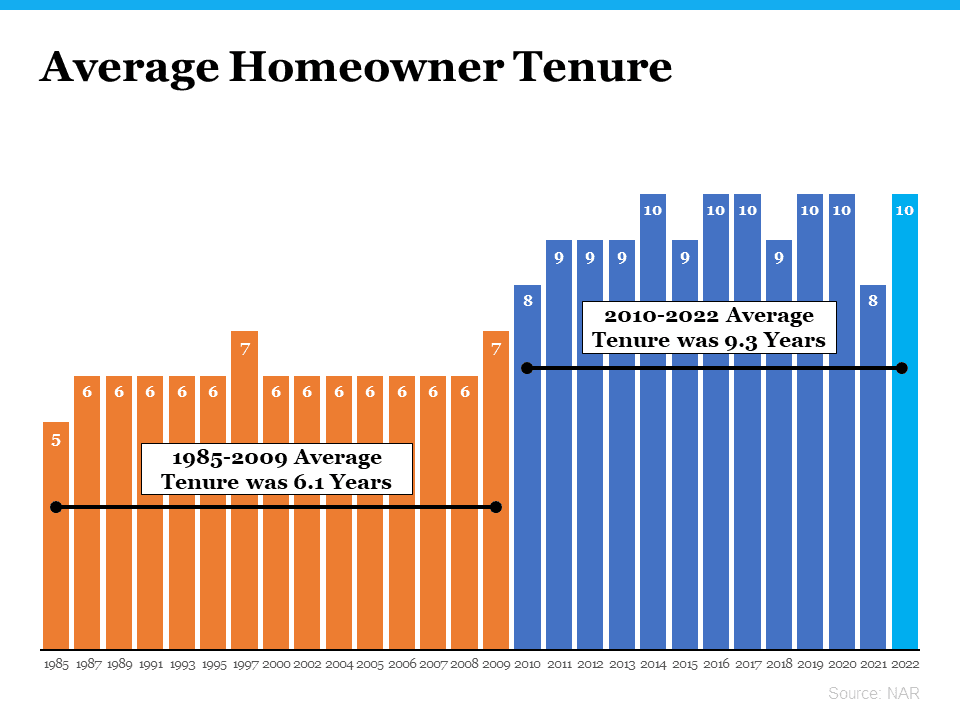
Another thing that has contributed to the inventory shortage is that people just stayed in their houses longer. From 1985 to 2009, the average tenure in a house was 6 years. After the crash, that number jumped 50%. Now, from 2010 to 2022, the average tenure in a house is 9 years. In other words, there is less inventory turnover, or less inventory coming to the market. You may notice that not every year is represented, but every year the National Association of REALTORS® (NAR) performed this survey is represented. Between 1985 and 2009, NAR did not conduct this survey annually. Years that appear to me “missing” were not omitted – there was simply no data for that period.
Today’s volatile interest rates also are contributing to the inventory shortage. Homeowners simply do not want to give up their current, low mortgage rates.
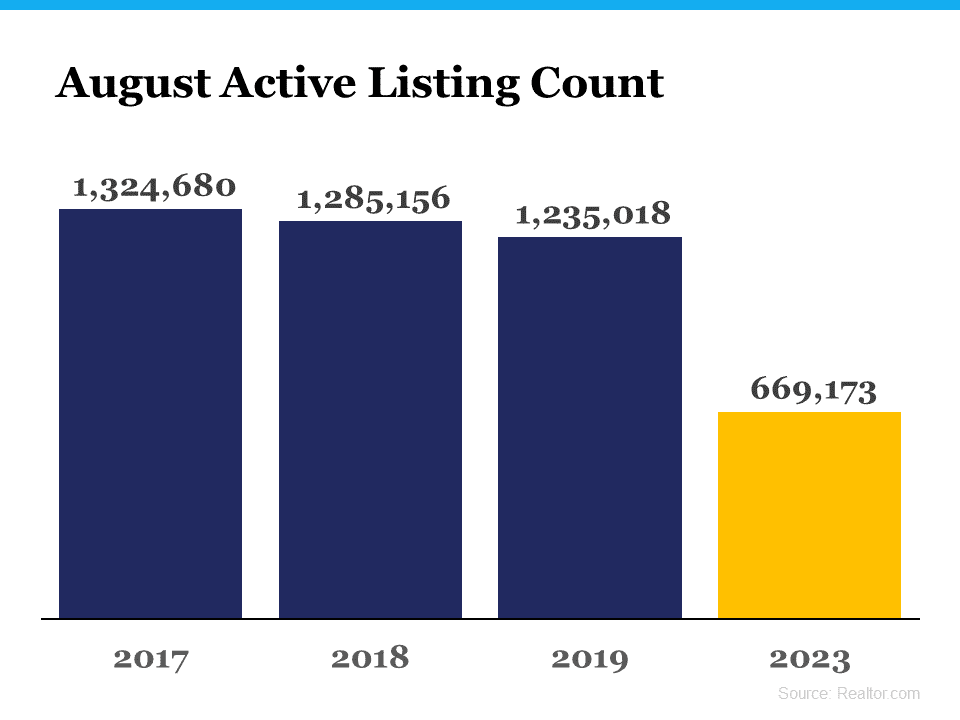
We have about half of the inventory we need when compared to the last three “normal” years in the real estate market.
Don’t misunderstand – we are seeing active listings go up, but the challenge remains that we are still far from the mark.
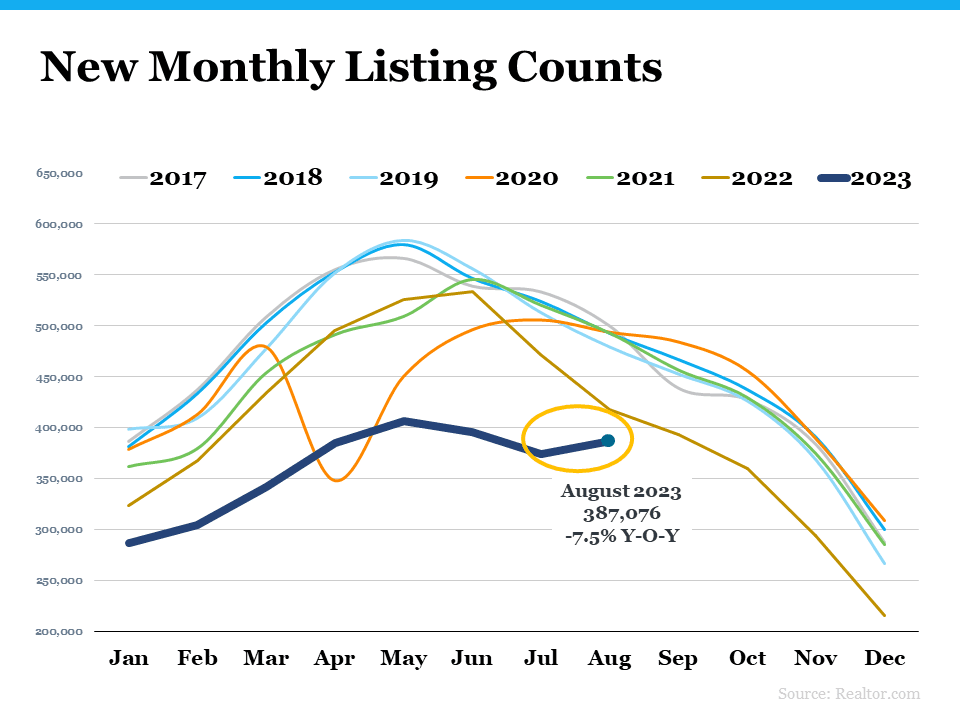
However, for the first time in 7 years, the number of new listings coming to market between July and August increased instead of decreased. This is notable. Inventory simply doesn’t jump from July to August. We don’t want to get too excited, because it is only one month of data, but it might indicate that sellers and buyers are beginning to accept that some of this, especially the mortgage rates, may very well be our “new normal.”
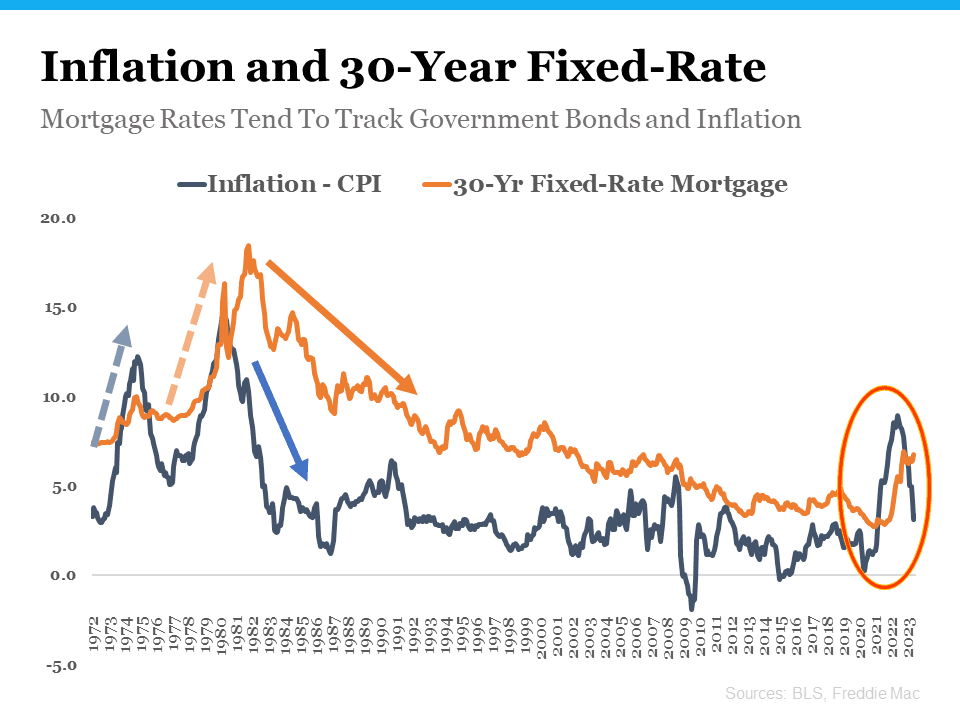
When it comes to taking a closer look at the mortgage rates, we can look to inflation. There is a historical relationship between inflation and the 30-year fixed rate, but we never want to say that mortgage rates are likely headed in any specific direction based on any one metric. A prime example is during the crash in 2009 and 2010. The historical relationship between inflation and the 30-year fixed rate was thrown out the window. And maybe that is similar to what is taking place right now, because inflation is dropping like a rock. However, the 30-year mortgage rates haven't followed suite yet, as they have in the past. Most experts are calling for a drop later this year, and seem to be projecting a mortgage rate in the high sixes. Some have also projected it could drop below 6% next year. In the meantime, down payment assistance programs could allow buyers to still purchase a home. Rental assistance programs could allow buyers to reduce their costs in order to save up for a down payment.
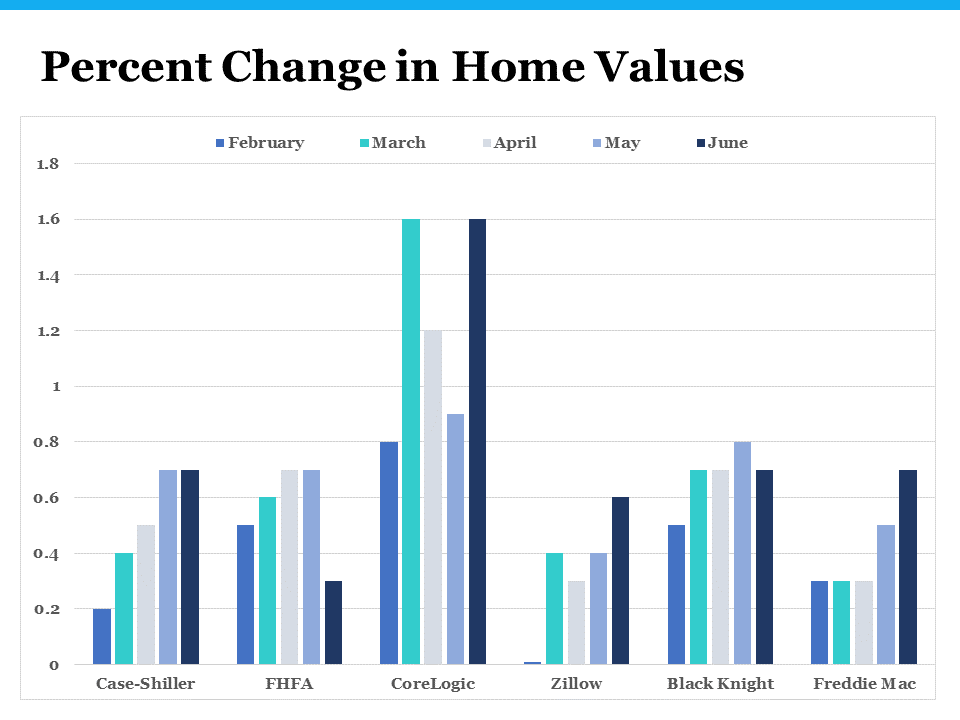
Month-over-month, home prices have been showing appreciation. Keep in mind that, to a certain degree, these industry experts may look at a different set of statistics to pull their figures from and each has their own methodology. For example, FHFA only looks at government-sponsored loans, whereas most others will look at all properties. However, they all seem to agree that we're headed back to more normal appreciation.
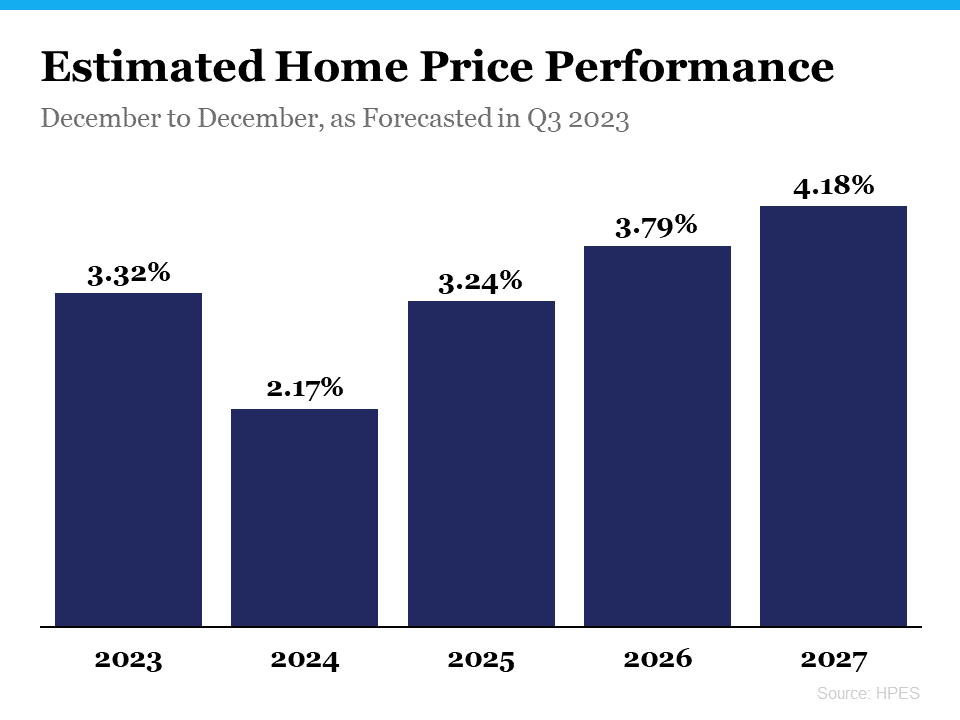
The Home Price Expectations Survey can also provide a helpful glance into the future of home prices. It is a nationwide panel of over 100 economists, real estate experts, and investment and market strategists who are surveyed by Pulsenomics every quarter. The numbers are strong that home prices will continue to appreciate at the normal, historical rate. That’s great news.
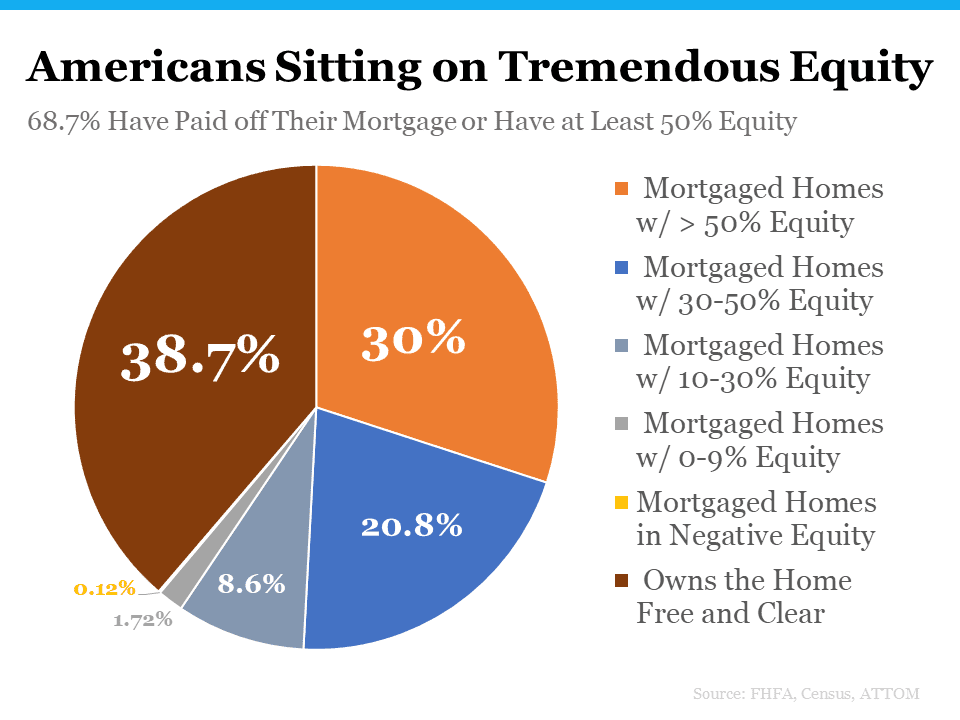
Because of the unprecedented home price growth we saw during and after the pandemic, homeowners are sitting on a tremendous amount of equity right now – probably more than they would have had if the market continued at the pace it was at before COVID. Almost 70% of homeowners own their home free and clear or have at least 50% equity. According to CoreLogic, homeowners are sitting on an average of $294,000 in equity. That could be enough to buy their next home cash, or provide an opportunity to combat the current mortgage rates.
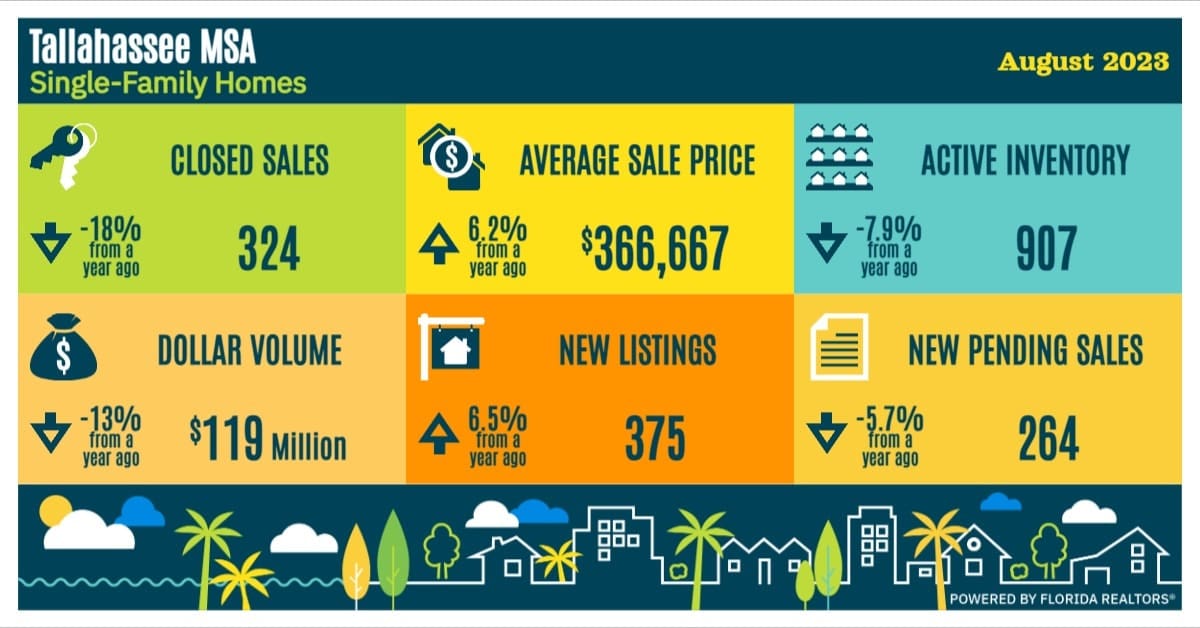
Finally, here is how we wrapped up last month in Tallahassee:
Stay up to date on the latest real estate trends.

All Real Estate News
June 23, 2026

All Real Estate News
June 22, 2026

All Real Estate News
June 18, 2026

All Real Estate News
June 17, 2026

All Real Estate News
June 16, 2026

All Real Estate News
June 15, 2026
You’ve got questions and we can’t wait to answer them.