June 2026 Real Estate Market Update
June 22, 2026
All Real Estate News

June 22, 2026
All Real Estate News
We're halfway through the year and many are wondering what the second half of the year is going to bring. This month we’ll take a look at the forecast, talk about home prices, and discuss why people are buying right now.
Is now the right time to buy? Should I buy? Should I wait? These are the questions many are asking right now, and affordability is one of the factors behind these concerns. Coming into this year, there were many positive predictions of seeing more home sales and lower mortgage rates than we saw in 2025. However, the recent geopolitical events have caused a lot of revision in the predictions for the 2026 real estate market.
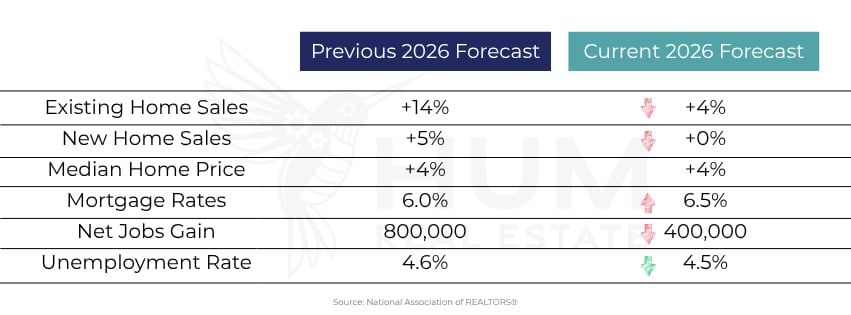
Looking back at the November 2025 forecasts for this year, everything except home prices and the unemployment rate has been adjusted for the worse. And, the unemployment rate was only adjusted by 0.1%.
It was predicted the market would sell 14% more homes this year, and now the forecast is for 4% - that’s a difference of 300,000 homes. Mortgage rates are now expected to increase by 0.5% of what the market originally thought, and job gains predictions were cut in half.
It’s great to have these figures to get an idea of what the overall market is contending with, but real estate is hyperlocal – some markets are growing and some are not. Even within certain markets, certain neighborhoods are seeing more sales at higher prices, while others are struggling to even meet the numbers from last year.
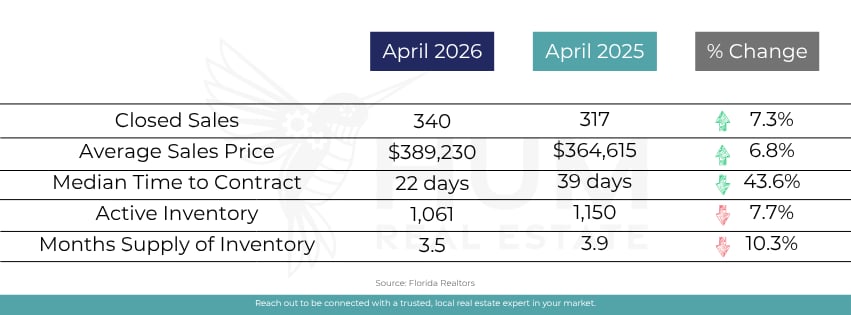
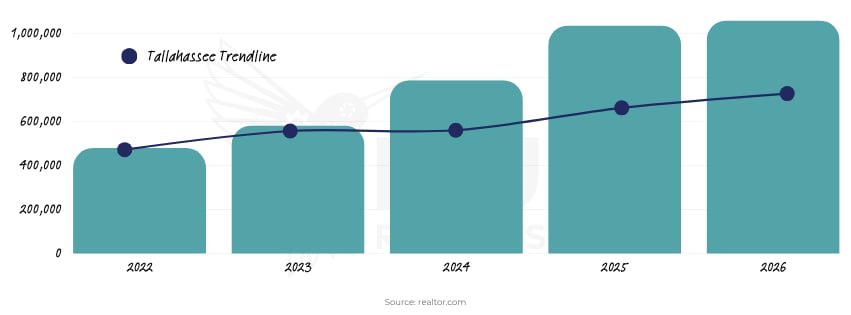
As an example, here is a breakdown of Tallahassee, Florida.
In Tallahassee, sales are up, sales prices are up, and how many days it takes a home to go under contract are down significantly from this time last year. Wonderful news. Locally, our issue is inventory. We simply do not have enough homes on the market to satisfy the demand.
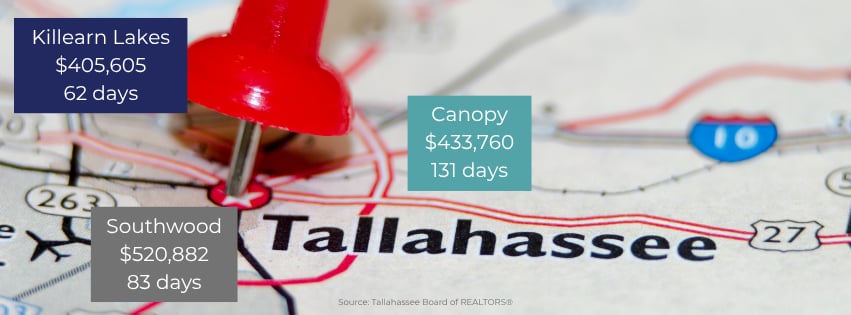
Again, from neighborhood to neighborhood the numbers can look quite different.
On the southside, Southwood has an average sales price of $520,885 with an average time on market (from listing to closing) of 83 days. On the eastside, Canopy has an average sales price of $433,760 with an average time on market of 131 days. And on the northside, Killearn Lakes has an average sales price of $405,605 with an average time on market of 62 days. Same city – very different statistics.
For a local real estate expert in your area, reach out and we’d be happy to connect you with someone who is trusted, proven, knowledgeable, and can run these same figures for your area.
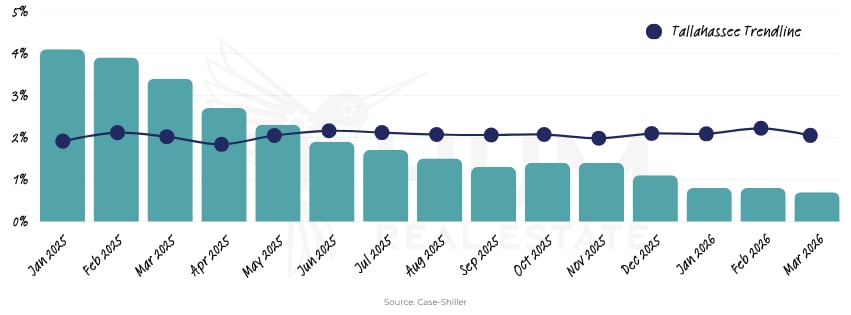
Home prices have slowed down - they haven't fallen negative, but they have not been increasing at as rapid of a pace as we might have seen recently.
There is still an upward pressure on home prices, albeit very slow. There are two main reasons for this: supply (inventory) and demand (buyers).
When it comes to inventory, the supply of homes has been rising now for four straight years.
More inventory on the market means more options for buyers, which drives prices down.
Pricing strategy is becoming critical for listings this spring… homes that are priced competitively and presented well are still drawing strong interest this spring, including multiple offers, sometimes above asking price…
National Association of REALTORS®
When it comes to buyer demand, that has been relatively limited due to both poor affordability and economic uncertainty.
Despite the pull back in price appreciation, there are no signals that we are headed for a major drop in home prices. In the current market, there are relatively few ‘forced sellers’ who need to get out at any price.
Lisa Sturtevant, Chief Economist, Bright MLS
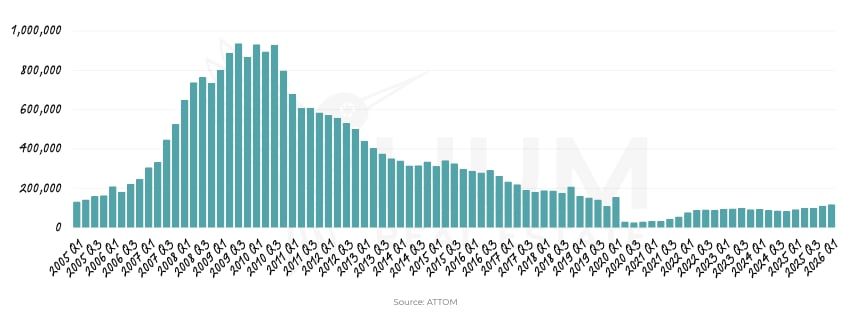
Rising foreclosure activity has been dominating many real estate headlines. Not to say foreclosures are not rising, but let’s put that into perspective.
Looking all the way back to 2005, foreclosure activity is relatively small – honestly, at a very normalized level today (118,727 filings).
In 2008, nine million people went through some sort of distressed transaction. We are no where near that number today.
Remember, too, that the post-COVID drop in foreclosure activity (that we are currently rising out of) was mostly due to the foreclosure moratoriums where borrowers could pause mortgage payments or request automatic foreclosure freezes based on hardships during and after the pandemic.
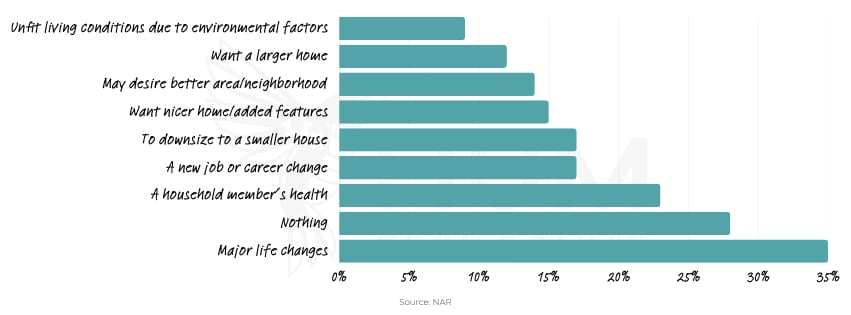
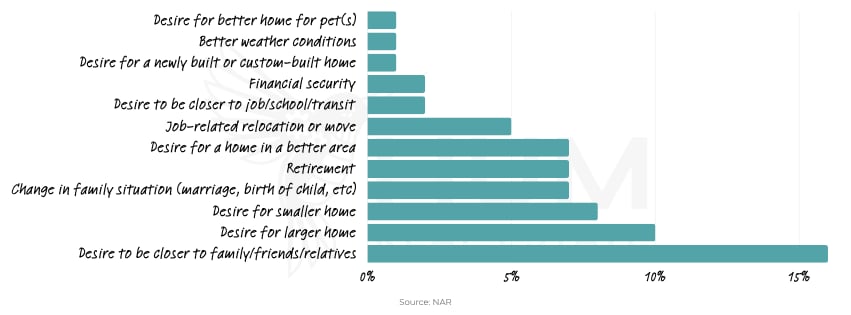
So, what is driving transactions right now? Life events.
Life doesn’t stand still — people get new jobs, grow their families, downsize after retirement, or simply want to live in a different neighborhood. Those needs are starting to outweigh the financial benefit of clinging to a rock bottom mortgage rate. As a result, more homes are hitting the market than we’ve seen in years, giving buyers a wider range of choices.
Chen Zhao, Head of Economics Research, Redfin
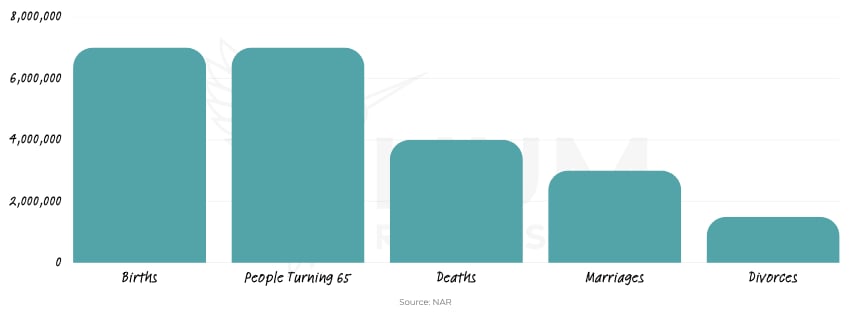
In a two-year time span, we have seen seven million births in this country, seven million people turning 65, four million deaths, three million marriages, and 1.5 million divorces.
Major life changes are why the majority of buyers are moving today.
Why? Because people buy homes for people – not finances.
Being closer to family is a big reason people are buying.
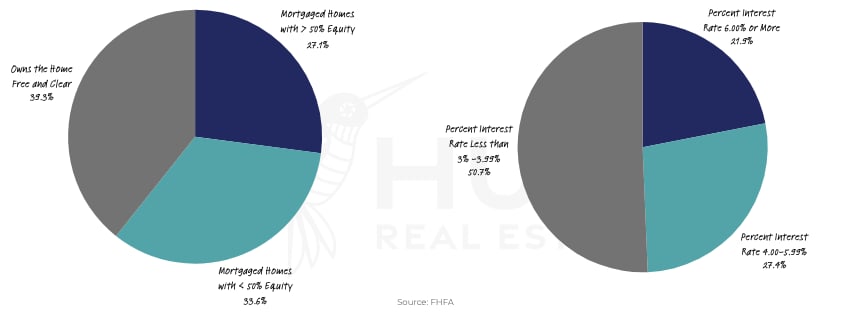
We do not have that market where there are forced sellers.
And why is that? Almost 40% of homeowners own their home free and clear. Of homeowners with a mortgage, over 50% have an interest rate of less than 4%.
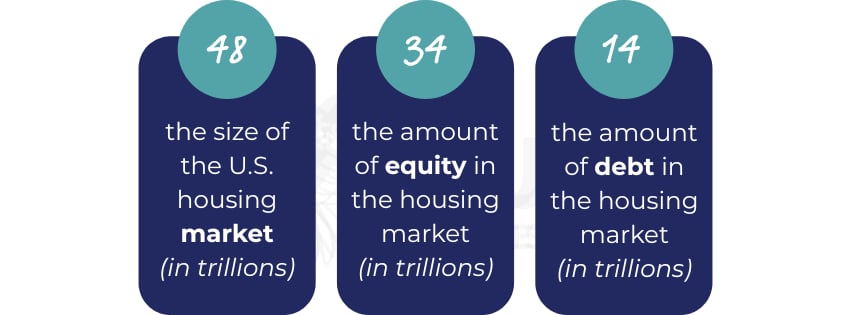
Of the 48 trillion-dollar U.S. housing market, 34 trillion dollars is home equity.
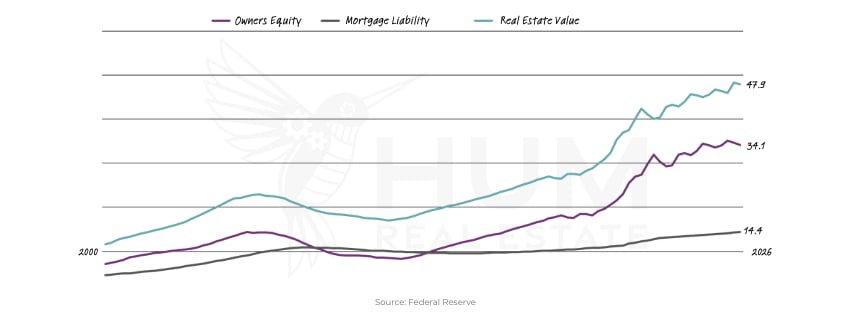
Now, $14 trillion in mortgage debt is the highest mortgage debt that we've ever seen. That is true. But, that’s not the whole story.
Home values are increasing and equity is increasing. Relatively, mortgage debt is flat.
Today’s real estate market is actually strong, but geopolitical events will continue to affect the housing market & 2026 forecasts. With the hyper locality of real estate, you will want to know what’s going on in your specific market.
Stay up to date on the latest real estate trends.

All Real Estate News
November 10, 2026

All Real Estate News
November 10, 2026

Local Events
November 7, 2026

Local Events
November 6, 2026
All Real Estate News
November 4, 2026

All Real Estate News
November 3, 2026
You’ve got questions and we can’t wait to answer them.